Answer the questions based off the graph.
1. What is shown on the X axis of this graph?
A. T...

SAT, 03.12.2021 07:00 jadalawler3
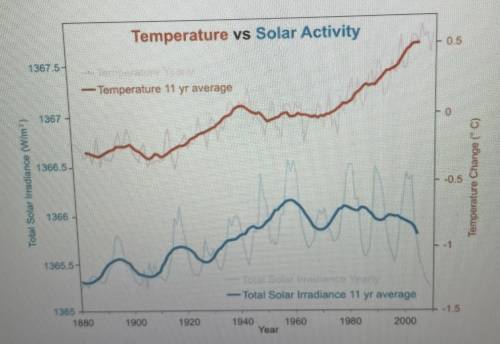
Answer the questions based off the graph.
1. What is shown on the X axis of this graph?
A. Temperature Change B. Year C. Solar irradiance or. D. Temperature vs solar activity
2. What is the average temperature reading in (oC) for the year 2000? (This is an estimate choose the number that would be closest)
A.-0.75. B.-0.49 C.0.5 or D.0.55
3.What year is tempature change average at its highest?
A. 1960 B. 1940 c. 2000 or d.1980
4. What year is solar irradiance at its highest?
A.1960
B.1940
C.2000
D.1980
Answers: 3
Another question on SAT
SAT, 26.06.2019 11:00
Essay questions may also be referred to as a. talk questions c. hard questions b. explain questions d. think questions
Answers: 2
SAT, 27.06.2019 06:00
The equation 24x2+25x−47ax−2=−8x−3−53ax−2 is true for all values of x≠2a, where a is a constant.what is the value of a? a) -16b) -3c) 3d) 16
Answers: 1
SAT, 27.06.2019 12:00
Use the rule of 72 to calculate how long it will take for your money to double if its earning 6% in interest. a. 12yrs b. 16yrs c. 36yrs d. 72yrs
Answers: 2
You know the right answer?
Questions

Biology, 25.05.2021 17:50

Spanish, 25.05.2021 17:50

Biology, 25.05.2021 17:50


Social Studies, 25.05.2021 17:50
Mathematics, 25.05.2021 17:50


