
Mathematics, 25.09.2021 21:20 homeworkprincess
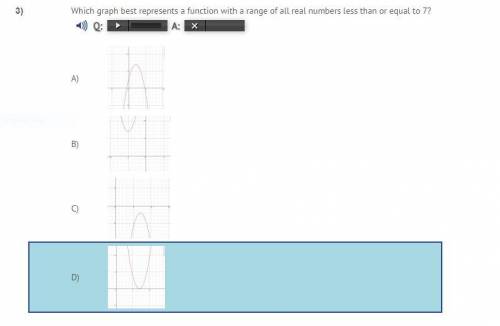
HELP? which graph best represents a function with a range of all real numbers less than or equal to 7?

Answers: 2
Another question on Mathematics
Mathematics, 21.06.2019 19:00
Give me the equations of two lines that have the same slope but are not parallel.
Answers: 3
Mathematics, 21.06.2019 19:30
Sundar used linear combination to solve the system of equations shown. he did so by multiplying the first equation by 5 and the second equation by another number to eliminate the y-terms. what number did sundar multiply the second equation by? 2x+9y=41 3x+5y=36
Answers: 1
Mathematics, 21.06.2019 19:40
It appears that people who are mildly obese are less active than leaner people. one study looked at the average number of minutes per day that people spend standing or walking. among mildly obese people, the mean number of minutes of daily activity (standing or walking) is approximately normally distributed with mean 376 minutes and standard deviation 64 minutes. the mean number of minutes of daily activity for lean people is approximately normally distributed with mean 528 minutes and standard deviation 107 minutes. a researcher records the minutes of activity for an srs of 7 mildly obese people and an srs of 7 lean people. use z-scores rounded to two decimal places to answer the following: what is the probability (image for it appears that people who are mildly obese are less active than leaner people. one study looked at the averag0.0001) that the mean number of minutes of daily activity of the 6 mildly obese people exceeds 420 minutes? what is the probability (image for it appears that people who are mildly obese are less active than leaner people. one study looked at the averag0.0001) that the mean number of minutes of daily activity of the 6 lean people exceeds 420 minutes?
Answers: 1
Mathematics, 21.06.2019 21:00
Circle a has a diameter of 7 inches, a circumference of 21.98 inches, and an area of 38.465 square inches. the diameter of circle b is 6 inches, the circumference is 18.84 inches, and the area is 28.26 square inches. part a: using the formula for circumference, solve for the value of pi for each circle. (4 points) part b: use the formula for area and solve for the value of pi for each circle. (4 points)
Answers: 2
You know the right answer?
HELP?
which graph best represents a function with a range of all real numbers less than or equal t...
Questions

Mathematics, 08.04.2021 21:20
Mathematics, 08.04.2021 21:20

Biology, 08.04.2021 21:20

Chemistry, 08.04.2021 21:20

English, 08.04.2021 21:20
History, 08.04.2021 21:20
Mathematics, 08.04.2021 21:20
English, 08.04.2021 21:20
Mathematics, 08.04.2021 21:20
Mathematics, 08.04.2021 21:20
Chemistry, 08.04.2021 21:20
History, 08.04.2021 21:20
History, 08.04.2021 21:20


