
Mathematics, 24.08.2021 05:10 kat9323
Plsss help 2nd part worth 100 points
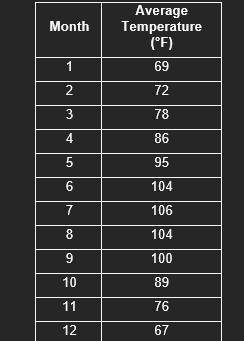
1. The average monthly high temperatures for Phoenix, Arizona from the years 1981-2010 are shown in the table below, with the value 1 representing the month of January, and the value of 12 representing the month of December. Complete the following steps to model the curve using the sine function. (1st picture)
a) Make a scatterplot of the data. Use the grid below or include a screenshot of the data plotted from a calculator.
b) What is the minimum temperature in the data set?
c) What is the maximum temperature in the data set?
d) What is the vertical shift, d, for the data set?
e) What is the amplitude, a, for the data set?
f) What is the period and frequency factor for the data set?
g) What is the phase shift for the data set?
h) Write an equation using the sine function that models this data set.
i) When would you expect the temperature in Phoenix to be 82°?
2. In the real-world, humans hear sound as an analog signal. This means the signal is a continuous waveform, which is completely processable by human ears. However, machines ‘hear’ sound a little differently, as they process sound digitally, which is a discrete waveform.
When sound is recorded or transmitted electronically, the continuous (analog) waveform is sampled to convert it to a discrete (digital) sequence. Sampling is the process of reducing a continuous-time signal to a discrete-time signal. As the sampling rate increases, the sound quality of the recording or transmission will improve.
The graphs below represent two different samples of a pure tone. Sample 1 is taken 8 times per unit of time. Sample 2 is taken 16 times per unit of time. (2nd and 3rd picture)
a) Why would sample 2 reproduce a better replication of the pure signal? (2 points)
b) Write a sinusoid model for Sample 2. (5 points)


Answers: 3
Another question on Mathematics
Mathematics, 21.06.2019 18:20
The number if marbles of different colors stored in a hat is listed below: 4 red marbles 10 green marbles 7 blue marbles. without looking in the hat, dan takes out a marble at random. he replaces the marble and then takes out another marble from the hat. what is the probability that dan takes out a blue marble in both draws?
Answers: 1
Mathematics, 21.06.2019 21:50
Rachel is studying the population of a particular bird species in a national park. she observes every 10th bird of that species that she can find in the park. her conclusion is that the birds living in the park who belong to that species generally feed on insects. rachel's sample is . based on the sample she picked, rachel's generalization is . reset next
Answers: 1
Mathematics, 21.06.2019 23:20
The graph of y=x3 is transformed as shown in the graph below. which equation represents the transformed function?
Answers: 1
Mathematics, 21.06.2019 23:30
The number of members f(x) in a local swimming club increased by 30% every year over a period of x years. the function below shows the relationship between f(x) and x: f(x) = 10(1.3)xwhich of the following graphs best represents the function? graph of f of x equals 1.3 multiplied by 10 to the power of x graph of exponential function going up from left to right in quadrant 1 through the point 0, 0 and continuing towards infinity graph of f of x equals 10 multiplied by 1.3 to the power of x graph of f of x equals 1.3 to the power of x
Answers: 1
You know the right answer?
Plsss help 2nd part worth 100 points
1. The average monthly high temperatures for Phoenix, Arizona...
Questions
Mathematics, 21.12.2020 17:30

English, 21.12.2020 17:30

Physics, 21.12.2020 17:30

Mathematics, 21.12.2020 17:30

World Languages, 21.12.2020 17:30


English, 21.12.2020 17:30


