
Mathematics, 10.06.2021 01:00 karen718
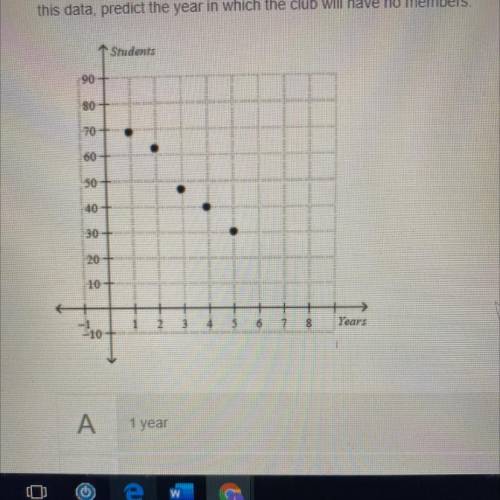
Question: The graph shows the relationship between the number of members in a club and the number of years after the club began. Based on the trend shown in
this data, predict the year in which the club will have no members.
Answer Choices:
A: 1 year
B: 3 years
C: 6 years
D: 8 years

Answers: 2
Another question on Mathematics
Mathematics, 21.06.2019 14:10
What is an equation of the line that passes through the point (-2,3) and is parallel to the line whose equations is y=3/2x-4? i am stuck between y=3/2x or y=3/2x+6 : (
Answers: 2
Mathematics, 21.06.2019 20:00
Someone answer asap for ! the boiling point of water at an elevation of 0 feet is 212 degrees fahrenheit (°f). for every 1,000 feet of increase in elevation, the boiling point of water decreases by about 2°f. which of the following represents this relationship if b is the boiling point of water at an elevation of e thousand feet? a. e = 2b - 212 b. b = 2e - 212 c. e = -2b + 212 d. b = -2e + 212
Answers: 1
Mathematics, 21.06.2019 21:10
If f(x) = 6x – 4, what is f(x) when x = 8? a2 b16 c44 d52
Answers: 2
You know the right answer?
Question: The graph shows the relationship between the number of members in a club and the number of...
Questions

Mathematics, 02.06.2021 20:20

Mathematics, 02.06.2021 20:20

Social Studies, 02.06.2021 20:20

English, 02.06.2021 20:20

Mathematics, 02.06.2021 20:20

Chemistry, 02.06.2021 20:20


