
Mathematics, 27.04.2021 18:30 maithe
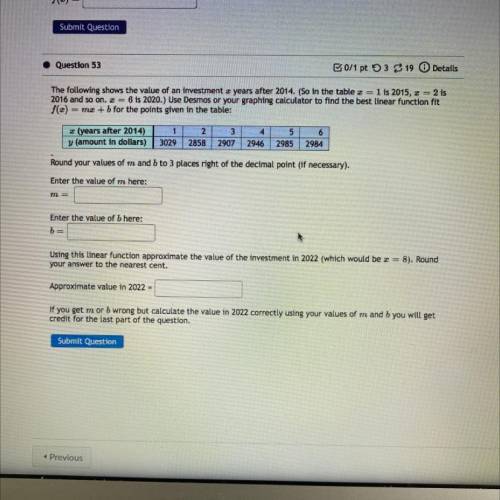
The following shows the value of an investment 2 years after 2014. (So in the table 2 = 1 is 2015, I = 2 is
2016 and so on. = = 6 is 2020.) Use Desmos or your graphing calculator to find the best linear function fit
f(2) = mx + b for the points given in the table:
3
(years after 2014)
y (amount in dollars)
1
3029
2
2858
2907
4
2946
5
2985
6
2984
Round your values of m and 6 to 3 places right of the decimal point (if necessary).
Enter the value of m here:
m =
Enter the value of b here:
be
Using this linear function approximate the value of the investment in 2022 (which would be 2 = 8). Round
your answer to the nearest cent.
Approximate value in 2022 -
If you get m or b wrong but calculate the value in 2022 correctly using your values of m and b you will get
credit for the last part of the question.
Submit Question

Answers: 1
Another question on Mathematics
Mathematics, 21.06.2019 17:00
If a baby uses 15 diapers in 2 days, how many diapers will the baby use in a year?
Answers: 2
Mathematics, 21.06.2019 17:30
What number should be added to the expression x^2+3x+ in order to create a perfect square trinomial? 3/2 3 9/4 9
Answers: 1
Mathematics, 21.06.2019 18:00
Write an equation for the function that includes the points (1,4/5) and (2,2/3)
Answers: 1
You know the right answer?
The following shows the value of an investment 2 years after 2014. (So in the table 2 = 1 is 2015, I...
Questions

Mathematics, 24.02.2021 01:00
Mathematics, 24.02.2021 01:00

Mathematics, 24.02.2021 01:00

History, 24.02.2021 01:00
English, 24.02.2021 01:00
Mathematics, 24.02.2021 01:00
Mathematics, 24.02.2021 01:00
Mathematics, 24.02.2021 01:00

Mathematics, 24.02.2021 01:00


