Which graph represents the solution to the system of inequalities?
x + y ≤ 50
x ≥ 20...

Mathematics, 17.09.2019 00:30 ilovemeatballs5
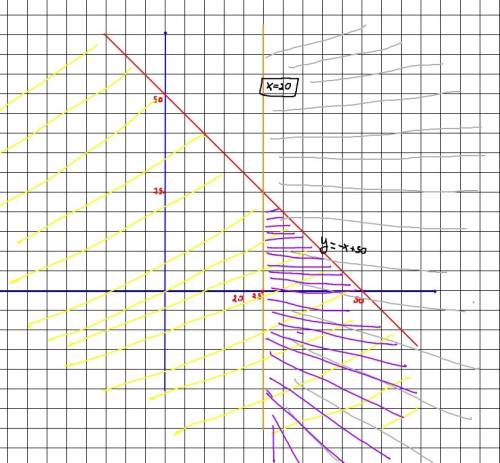
Which graph represents the solution to the system of inequalities?
x + y ≤ 50
x ≥ 20

Answers: 1
Another question on Mathematics
Mathematics, 21.06.2019 14:30
Because of your favorite lemonade it is $3.84 for 3 gallons. write this as an unit rate
Answers: 2
Mathematics, 21.06.2019 17:30
Gregory draws a scale drawing of his room. the scale that he uses is 1 cm : 4 ft. on his drawing, the room is 3 centimeters long. which equation can be used to find the actual length of gregory's room?
Answers: 1
Mathematics, 21.06.2019 23:00
1. an economy consists of three workers: larry, moe, and curly. each works 10 hours a day and can produce two services: mowing lawns and washing cars. in an hour, larry can either mow one lawn or wash one car; moe can either mow one lawn or wash two cars; and curly can either mow two lawns or wash one car. a. calculate how much of each service is produced under the following circumstances: a. all three spend all their time mowing lawns. b. all three spend all their time washing cars. c. all three spend half their time on each activity d. larry spends half of his time on each activity, while moe only washes cars and curly only mows lawns b. using your answers to part a, draw a production possibilities frontier and label points a, b, c, and d on your graph. explain why the production possibilities frontier has the shape it does. c. are any of the allocations calculated in part a inefficient? explain.
Answers: 3
You know the right answer?
Questions

Arts, 06.05.2020 04:43

History, 06.05.2020 04:43
Mathematics, 06.05.2020 04:43


Computers and Technology, 06.05.2020 04:43


Mathematics, 06.05.2020 04:43

Biology, 06.05.2020 04:43
SAT, 06.05.2020 04:44


