
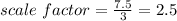
 -----> the scale factor is greater than
  (because is an enlargement)
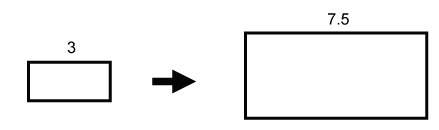
What scale factor was applied to the first rectangle to get the resulting image?
enter...

Mathematics, 18.10.2019 02:10 robert7248
What scale factor was applied to the first rectangle to get the resulting image?
enter your answer as a decimal in the box.

Answers: 2
Another question on Mathematics
Mathematics, 21.06.2019 15:00
What kinds of numbers make up the set of numbers called the real numbers? give examples when you explain a number type. there are a limited set of types of numbers, but an unlimited number of examples of these numbers.
Answers: 3
Mathematics, 21.06.2019 18:30
Write an inequality and solve each problem.for exercises 11 and 12, interpret the solution.
Answers: 1
Mathematics, 21.06.2019 20:10
A. use the formula for continuous compounding with the original example: $1000 invested at 2% for 1 year. record the amount to 5 decimal places. use a calculator. b. compare it to the result using the original compound interest formula with n = 365 calculated to 5 decimal places. which has a larger value? explain.
Answers: 1
Mathematics, 22.06.2019 02:00
1. the manager of collins import autos believes the number of cars sold in a day (q) depends on two factors: (1) the number of hours the dealership is open (h) and (2) the number of salespersons working that day (s). after collecting data for two months (53 days), the manager estimates the following log-linear model: q 4 equation 1 a. explain, how to transform the log-linear model into linear form that can be estimated using multiple regression analysis. the computer output for the multiple regression analysis is shown below: q4 table b. how do you interpret coefficients b and c? if the dealership increases the number of salespersons by 20%, what will be the percentage increase in daily sales? c. test the overall model for statistical significance at the 5% significance level. d. what percent of the total variation in daily auto sales is explained by this equation? what could you suggest to increase this percentage? e. test the intercept for statistical significance at the 5% level of significance. if h and s both equal 0, are sales expected to be 0? explain why or why not? f. test the estimated coefficient b for statistical significance. if the dealership decreases its hours of operation by 10%, what is the expected impact on daily sales?
Answers: 2
You know the right answer?
Questions


History, 28.09.2019 02:30

Biology, 28.09.2019 02:30
History, 28.09.2019 02:30

Social Studies, 28.09.2019 02:30

History, 28.09.2019 02:30
Biology, 28.09.2019 02:30
Biology, 28.09.2019 02:30
Mathematics, 28.09.2019 02:30

Social Studies, 28.09.2019 02:30
Mathematics, 28.09.2019 02:30
Mathematics, 28.09.2019 02:30

Computers and Technology, 28.09.2019 02:30


