
Mathematics, 14.04.2021 18:40 kp328
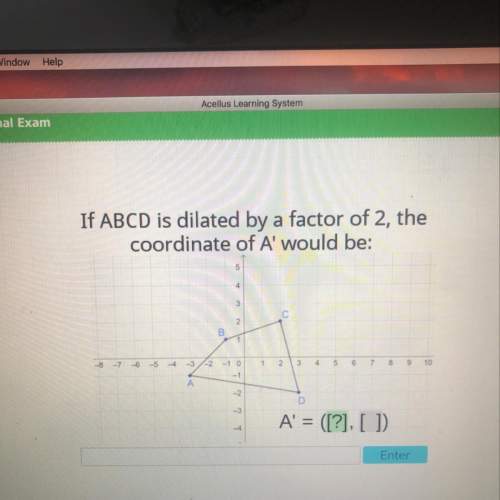
Using data from a recent study, Jack prepared a scatter plot and created a best fit line, as shown below. Melani said that the best fit line was incorrect because the data had a positive association. Danesha said that the best fit line was incorrect because, while the data had a negative association, his slope was way off. Krystal said that the best fit line was incorrect because he just connected 2 points from the data and did not draw it so that it was as close to all of the points as possible. Who was right?
A
Jack
B
Melani
C
Danesha
D
Krystal

Answers: 2
Another question on Mathematics
Mathematics, 21.06.2019 16:40
The graph of which equation includes the points (0, 10) and (10, 11)? y = 10x + 11 y = x + 10 y= 1/10x + 10 y = 1/10x + 11
Answers: 1
Mathematics, 22.06.2019 01:00
Luis has a cooler filled with cans of soda.for every 5 cans of coke there are 3 cans of sprite.if there are 25 cans of coke, how mant cans of sprite are there?
Answers: 2
Mathematics, 22.06.2019 01:30
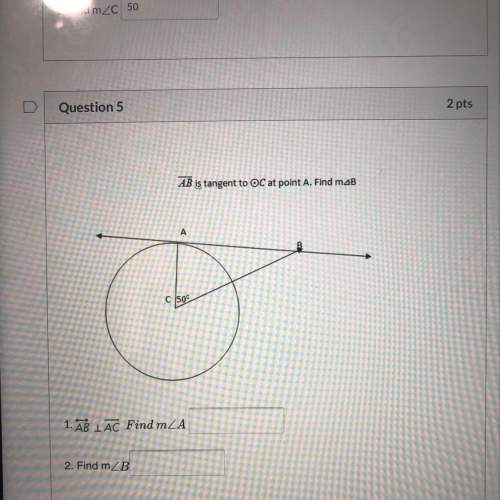
Urgent need asap △abc is similar to △xyz. also, side ab measures 6 cm, side bc measures 18 cm, and side xy measures 12 cm. what is the measure of side yz ? enter your answer in the box.
Answers: 1
You know the right answer?
Using data from a recent study, Jack prepared a scatter plot and created a best fit line, as shown b...
Questions

Mathematics, 27.07.2019 00:10
Mathematics, 27.07.2019 00:10
Mathematics, 27.07.2019 00:10
Mathematics, 27.07.2019 00:10


