
Mathematics, 01.02.2021 17:00 kayranicole1
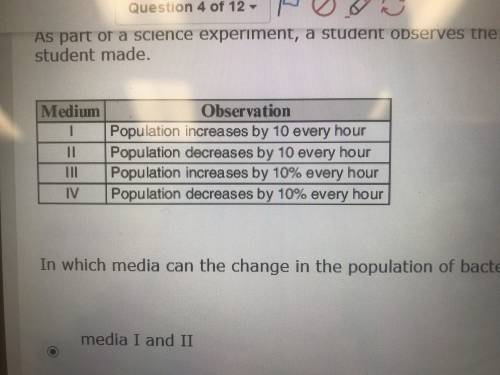
As part of a science experiment, a student observes the growth of a population of bacteria in four different media. The table below lists the observations the student made.
Medium
Observation
1
Population increases by 10 every hour
II
Population decreases by 10 every hour
THI Population increases by 10% overy hour
M Population decreases by 10% every hour
In which media can the change in the population of bacteria be modeled by a linear function?
media I and II
media I and III
media II and IV
media III and IV

Answers: 1
Another question on Mathematics
Mathematics, 21.06.2019 17:30
What is the range of the relation in the table below? x y –2 0 –1 2 0 4 1 2 2 0
Answers: 3
Mathematics, 21.06.2019 18:00
If you had $1,900,000, how many days would it take you to spend all if you spent $1 a second. (there are 86,400 seconds in a day)
Answers: 1
Mathematics, 21.06.2019 19:50
Drag each tile into the correct box. not all tiles will be used. find the tables with unit rates greater than the unit rate in the graph. then tenge these tables in order from least to greatest unit rate
Answers: 2
You know the right answer?
As part of a science experiment, a student observes the growth of a population of bacteria in four d...
Questions

English, 05.07.2019 01:30
English, 05.07.2019 01:30
Mathematics, 05.07.2019 01:30
Mathematics, 05.07.2019 01:30
Mathematics, 05.07.2019 01:30

Biology, 05.07.2019 01:30
Mathematics, 05.07.2019 01:30

Social Studies, 05.07.2019 01:30

Physics, 05.07.2019 01:30
English, 05.07.2019 01:30


