
Mathematics, 11.01.2021 21:10 C4171
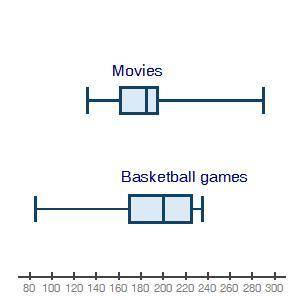
The box plots below show attendance at a local movie theater and high school basketball games
Which of the following best describes how to measure the spread of the data?
A- The IQR is a better measure of spread for movies than it is for basketball games.
B- The standard deviation is a better measure of spread for movies than it is for basketball games.
C- The IQR is the best measurement of spread for games and movies.
D- The standard deviation is the best measurement of spread for games and movies.

Answers: 2
Another question on Mathematics
Mathematics, 21.06.2019 14:00
Demonstrate the proof of your new polynomial identity through an algebraic proof and a numerical proof in an engaging way! make it so the whole world wants to purchase your polynomial identity and can't imagine living without it! you must: label and display your new polynomial identity prove that it is true through an algebraic proof, identifying each step demonstrate that your polynomial identity works on numerical relationships create your own using the columns below. see what happens when different binomials or trinomials are combined. square one factor from column a and add it to one factor from column b to develop your own identity. column a column b (x − y) (x2 + 2xy + y2) (x + y) (x2 − 2xy + y2) (y + x) (ax + b) (y − x) (cy + d)
Answers: 3
Mathematics, 21.06.2019 16:00
Use set buikder notation to represent the following set: {, -2, -1, 0}
Answers: 1
Mathematics, 21.06.2019 18:00
In the polynomial below, what number should replace the question mark to produce a difference of squares? x2 + ? x - 36
Answers: 3
Mathematics, 21.06.2019 22:20
Igure 1 and figure 2 are two congruent parallelograms drawn on a coordinate grid as shown below: 4 quadrant coordinate grid showing two parallelograms. figure 1 has vertices at negative 5, 2 and negative 3, 4 and negative 4, 7 and negative 6, 5. figure 2 has vertices at 5, negative 2 and 7, negative 4 and 6, negative 7 and 4, negative 5. which two transformations can map figure 1 onto figure 2? reflection across the y-axis, followed by reflection across x-axis reflection across the x-axis, followed by reflection across y-axis reflection across the x-axis, followed by translation 10 units right reflection across the y-axis, followed by translation 5 units down
Answers: 1
You know the right answer?
The box plots below show attendance at a local movie theater and high school basketball games
Which...
Questions


