Question
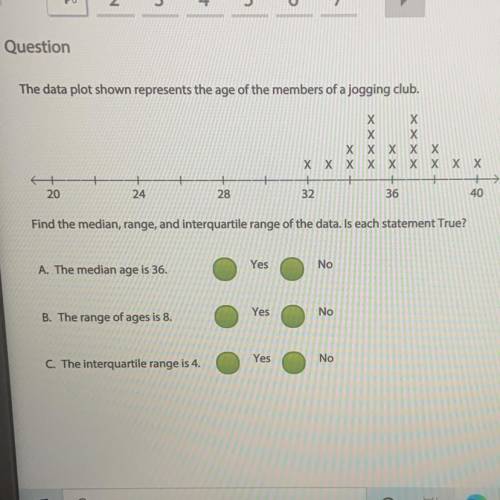
The data plot shown represents the age of the members of a jogging club.
Х Х
Х...

Mathematics, 06.01.2021 02:10 serenityjohnson98765
Question
The data plot shown represents the age of the members of a jogging club.
Х Х
Х Х
X X X X Х
X X X X X X X X X
20
24
28
32
36
40
Find the median, range, and interquartile range of the data. Is each statement True?
A. The median age is 36.
Yes
No
B. The range of ages is 8.
Yes
No
C. The interquartile range is 4.
Yes
No

Answers: 3
Another question on Mathematics
Mathematics, 21.06.2019 13:00
Zoe placed colored blocks on a scale in science class. each block weighed 0.8 ounces. the total weight of all the colored blocks was 12.8 ounces. how many blocks did zoe place on the scale? write and solve an equation to find the answer.
Answers: 2
Mathematics, 21.06.2019 16:30
What is the name used to describe a graph where for some value of x, there exists 2 or more different values of y?
Answers: 2
Mathematics, 21.06.2019 22:10
Which function can be used to model the monthly profit for x trinkets produced? f(x) = –4(x – 50)(x – 250) f(x) = (x – 50)(x – 250) f(x) = 28(x + 50)(x + 250) f(x) = (x + 50)(x + 250)
Answers: 2
You know the right answer?
Questions
Engineering, 07.10.2020 14:01

History, 07.10.2020 14:01
Mathematics, 07.10.2020 14:01


Computers and Technology, 07.10.2020 14:01


Mathematics, 07.10.2020 14:01

Social Studies, 07.10.2020 14:01
History, 07.10.2020 14:01
Mathematics, 07.10.2020 14:01
Mathematics, 07.10.2020 14:01

Biology, 07.10.2020 14:01


