The graph shows the relationship between time
and the number of soda bottles a machine can
ma...

Mathematics, 06.11.2020 17:50 MayFlowers
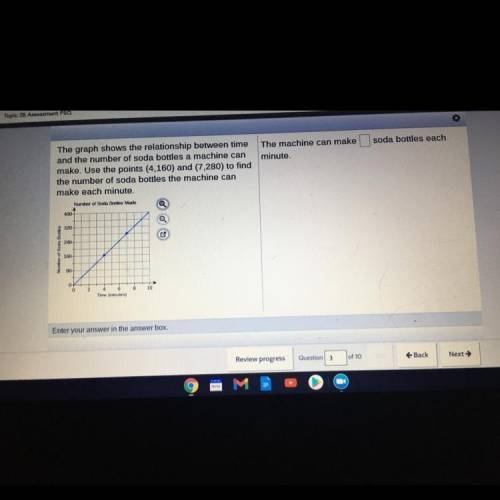
The graph shows the relationship between time
and the number of soda bottles a machine can
make. Use the points (4,160) and (7,280) to find
the number of soda bottles the machine can
make each minute.
PLSSS HELP!!!

Answers: 1
Another question on Mathematics
Mathematics, 21.06.2019 18:10
What is the equation in slope-intercept form of the linear function represented by the table? y -18 -1 -8 4 2 912 o y=-2x-6 o y=-2x+6 o y=2x-6 o y = 2x+6
Answers: 1
Mathematics, 21.06.2019 18:40
(mc 02.03) what set of reflections and rotations would carry rectangle abcd onto itself? reflect over the y-axis, reflect over the x-axis, rotate 180° rotate 180°, reflect over the x-axis, reflect over the line y=x reflect over the x-axis, rotate 180°, reflect over the x-axis rotate 180, reflect over the y-axis, reflect over the line y=x
Answers: 1
Mathematics, 21.06.2019 21:20
The edge of a cube was found to be 30 cm with a possible error in measurement of 0.4 cm. use differentials to estimate the maximum possible error, relative error, and percentage error in computing the volume of the cube and the surface area of the cube. (round your answers to four decimal places.) (a) the volume of the cube maximum possible error cm3 relative error percentage error % (b) the surface area of the cube maximum possible error cm2 relative error percentage error %
Answers: 3
Mathematics, 21.06.2019 22:50
Which of the following is closest to 32.9 x 7.5? a: 232 b: 259 c: 220 d: 265
Answers: 2
You know the right answer?
Questions


Computers and Technology, 23.10.2019 04:00


