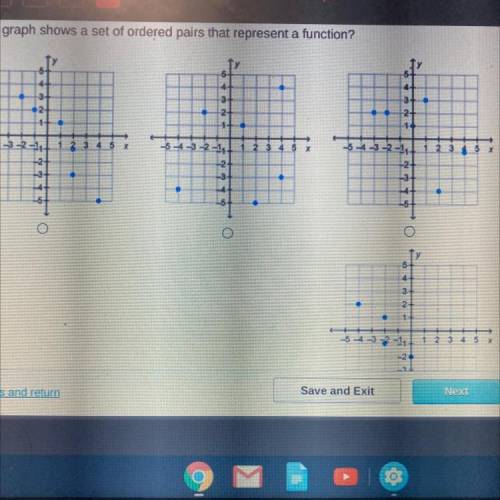
Which graph shows a set of ordered pairs that represent a function?
Help plzzz
...

Mathematics, 05.10.2020 23:01 xemnas1994
Which graph shows a set of ordered pairs that represent a function?
Help plzzz

Answers: 2
Another question on Mathematics
Mathematics, 21.06.2019 18:30
The table shows the relationship between the number of cups of cereal and the number of cups of raisins in a cereal bar recipe: number of cups of cereal number of cups of raisins 8 2 12 3 16 4 molly plotted an equivalent ratio as shown on the grid below: a graph is shown. the title of the graph is cereal bars. the horizontal axis label is cereal in cups. the x-axis values are 0, 20, 40, 60, 80,100. the vertical axis label is raisins in cups. the y-axis values are 0, 10, 20, 30, 40, 50. a point is plotted on the ordered pair 40,20. which of these explains why the point molly plotted is incorrect? (a) if the number of cups of cereal is 40, then the number of cups of raisins will be10. (b)if the number of cups of raisins is 40, then the number of cups of cereal will be10. (c) if the number of cups of cereal is 40, then the number of cups of raisins will be 80. (d) if the number of cups of raisins is 40, then the number of cups of cereal will be 80.
Answers: 1
Mathematics, 21.06.2019 19:10
Which of the following is the shape of a cross section of the figure shown below
Answers: 3
Mathematics, 21.06.2019 20:10
The population of a small rural town in the year 2006 was 2,459. the population can be modeled by the function below, where f(x residents and t is the number of years elapsed since 2006. f(t) = 2,459(0.92)
Answers: 1
Mathematics, 22.06.2019 03:00
The biologist has a second culture to examine. she knows that the population of the culture doubles every 15 minutes. after 1 hour and 15 minutes, her assistant found that 80,000 bacteria were present. a) what was the size of the initial population? b) predict the size of the culture at t=3 hours. what was the size of the population at 40 minutes? explain and justify your answers. c) create a graph of the population as a function of time. find an equation that can be used to predict the size of the population at any time t. d) examine the rate at which the bacteria culture is growing. how fast is the culture growing after 1 hour? after 1.5 hours? after 2 hours? use a time interval of h = 0.01 hours to estimate these rates. interpret these rates in terms of the context of the problem situation. how do these three rates compare?
Answers: 1
You know the right answer?
Questions


History, 01.07.2021 01:30

Mathematics, 01.07.2021 01:30

Mathematics, 01.07.2021 01:30

Law, 01.07.2021 01:30


