
Mathematics, 20.09.2020 15:01 10040813
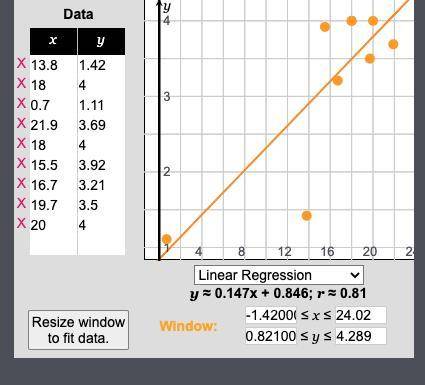
Step 1: Collect and organize your data. Using the Super Survey Simulator, survey 10 students of your choice and gather data. Create an organized representation of your data below. What do you think the purpose of this survey is? Explain. The main purpose of the survey is to see how the amount of studying you do relates to your overall GPA Step 2: Graph your data. After organizing your data, you will now create a graphical representation of your data. Why is a scatterplot an appropriate display for this data set? A scatter plot can also be useful for identifying other patterns in data. We can divide data points into groups based on how closely sets of points cluster together. Scatter plots can also show if there are any unexpected gaps in the data and if there are any outlier points What features would need to be included on a scatterplot so that the data can be easily analyzed? Make a list of needed features and explain why each is important to the graph. The more plot point the better but you must have at least three points, a labeled X-axis and Y-axis, and a table for the data to be organized into. Next, you will make a scatterplot. Name a point that will be on your scatterplot and describe what it represents. DATA USED: CAFE, CLASS ROOM Using the regression calculator in your tool bar, create a scatterplot using your data set from step 1. Insert a screenshot of your scatterplot, or recreate it below. HOURS: X GPA: Y Now that you have represented your data graphically, it can be more easily analyzed. Describe how the line of best fit and the correlation coefficient can be used to determine the correlation between the two variables on your graph. 1. Describe the type of correlation between the two variables on your graph. How do you know? 2.Does the correlation between the variables imply causation? Explain. 3.How do you calculate the residuals for a scatterplot? 4.Calculate the residuals for your scatterplot in step 2d.

Answers: 1
Another question on Mathematics
Mathematics, 21.06.2019 17:00
How do businesses a country's economy? a. by investing in goods and services b. by increasing the unemployment rate c. by making profits
Answers: 2
Mathematics, 21.06.2019 22:30
Ibeg you to me 20. a reaction produces 4.93 l of oxygen, but was supposed to produce 1 mol of oxygen. what is the percent yield?
Answers: 3
Mathematics, 21.06.2019 23:30
Arestaurant added a new outdoor section that was 8 feet wide and 6 feet long. what is the area of their new outdoor section
Answers: 1
You know the right answer?
Step 1: Collect and organize your data. Using the Super Survey Simulator, survey 10 students of your...
Questions

Mathematics, 16.10.2020 16:01


English, 16.10.2020 16:01
Social Studies, 16.10.2020 16:01
Mathematics, 16.10.2020 16:01

Biology, 16.10.2020 16:01
Mathematics, 16.10.2020 16:01
English, 16.10.2020 16:01
English, 16.10.2020 16:01
Biology, 16.10.2020 16:01
Mathematics, 16.10.2020 16:01
English, 16.10.2020 16:01


