The data set below shows the weights of some puppies, in pounds, at a kennel:
10, 10, 10...

Mathematics, 05.05.2020 23:18 booherc78
The data set below shows the weights of some puppies, in pounds, at a kennel:
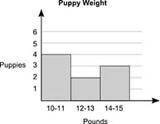
10, 10, 10, 11, 12, 12, 14, 14, 15
Which histogram represents the data set?
A histogram is shown with title Puppy Weight. On the horizontal axis, the title is Pounds. The title on the vertical axis is Puppies. The range on the horizontal axis is 10 to 11, 12 to 13, and 14 to 15. The values on the vertical axis are from 0 to 6 at intervals of 1. The bar for the first range goes to 2, the bar for the second range goes to 4, the bar for the third range goes to 3.
A histogram is shown with title Puppy Weight. On the horizontal axis, the title is Pounds. The title on the vertical axis is Puppies. The range on the horizontal axis is 10 to 11, 12 to 13, and 14 to 15. The values on the vertical axis are from 0 to 6 at intervals of 1. The bar for the first range goes to 3, the bar for the second range goes to 4, the bar for the third range goes to 2.
A histogram is shown with title Puppy Weight. On the horizontal axis, the title is Pounds. The title on the vertical axis is Puppies. The range on the horizontal axis is 10 to 11, 12 to 13, and 14 to 15. The values on the vertical axis are from 0 to 6 at intervals of 1. The bar for the first range goes to 2, the bar for the second range goes to 3, the bar for the third range goes to 4.
A histogram is shown with title Puppy Weight. On the horizontal axis, the title is Pounds. The title on the vertical axis is Puppies. The range on the horizontal axis is 10 to 11, 12 to 13, and 14 to 15. The values on the vertical axis are from 0 to 6 at intervals of 1. The bar for the first range goes to 4, the bar for the second range goes to 2, the bar for the third range goes to 3.

Answers: 3
Another question on Mathematics
Mathematics, 21.06.2019 17:30
Lems1. the following data set represents the scores on intelligence quotient(iq) examinations of 40 sixth-grade students at a particular school: 114, 122, 103, 118, 99, 105, 134, 125, 117, 106, 109, 104, 111, 127,133, 111, 117, 103, 120, 98, 100, 130, 141, 119, 128, 106, 109, 115,113, 121, 100, 130, 125, 117, 119, 113, 104, 108, 110, 102(a) present this data set in a frequency histogram.(b) which class interval contains the greatest number of data values? (c) is there a roughly equal number of data in each class interval? (d) does the histogram appear to be approximately symmetric? if so,about which interval is it approximately symmetric?
Answers: 3
Mathematics, 21.06.2019 19:00
In a class, there are 12 girls. if the ratio of boys to girls is 5: 4 how many boys are there in the class
Answers: 1
Mathematics, 21.06.2019 21:00
Suppose that in 2008 , 840,800 citizens died of a certain disease assuming the population of teh country is 399 miliion, what is the mortality rate in units of deaths per 100,000 people?
Answers: 1
Mathematics, 21.06.2019 21:00
Sweet t saved 20 percent of the total cost of the green-eyed fleas new album let there be fleas on earth. if the regular price is $30 how much did sweet save
Answers: 1
You know the right answer?
Questions


Spanish, 11.01.2020 14:31
Mathematics, 11.01.2020 14:31
English, 11.01.2020 14:31
Mathematics, 11.01.2020 14:31
English, 11.01.2020 14:31

Chemistry, 11.01.2020 14:31
Mathematics, 11.01.2020 14:31
Mathematics, 11.01.2020 14:31

Physics, 11.01.2020 14:31

History, 11.01.2020 14:31

Biology, 11.01.2020 14:31
Mathematics, 11.01.2020 14:31
Biology, 11.01.2020 14:31
History, 11.01.2020 14:31
Mathematics, 11.01.2020 14:31


