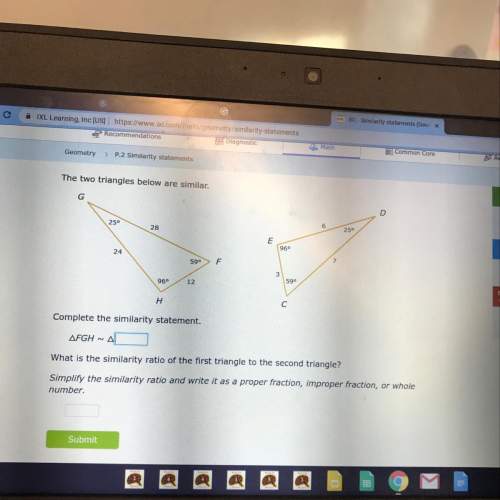
Completed
✓ Completed
In Progress
Use the chart and the histogram to answer 3-5.
Ages of People at a Bowling Alley
6
21
45
48
15 17 | 18 12 24
24 52 229
17
Click the icon to view the histogram.
3. Just as Bobby finished making his histogram, a group of 6 people started playing. He wants to
include their ages, which are 8, 16, 26, 27, 49, and 51. How should Bobby change his histogram to
include these ages?
Content
to
that is
units
Add to the first bar, to the second bar, make a new bar for
tall, and add to the last bar.
Enter your answer in the edit fields and then click Check Answer.
2
parts
Clear All
2 remaining
Review progress
Question 3
of 4
Back
Next