
Mathematics, 11.04.2020 04:47 jaydenbomkamp6084
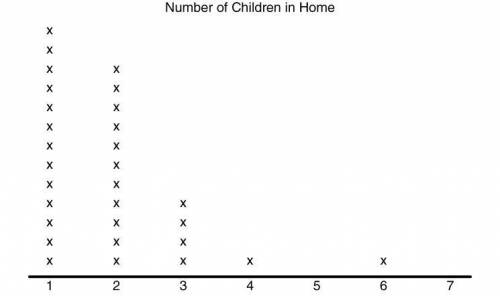
The following dot plot represents a random sample of elementary students and the number of children that live in their home.
If this random sample is representative of elementary students in the United States, which of the following inferences can be made from the data? Select all that apply.
All households in the United States contain at least one child.
Very few households in the United States contain four or more children.
None of the households in the United States contain five children.
The majority of the households in the United States, with at least one child, contain less than three children.

Answers: 2
Another question on Mathematics
Mathematics, 21.06.2019 19:30
Order the measurements from the least to the greatest. 2,720 ml , 24.91 l , 0.0268 kl
Answers: 1
Mathematics, 21.06.2019 22:00
The median am of triangle ∆abc is half the length of the side towards which it is drawn, bc . prove that triangle ∆abc is a right triangle, and find angle mac and abm
Answers: 1
Mathematics, 22.06.2019 01:30
As a self-employed seamstress, you know that it takes 7 yards of material to make 3 jackets. you bought 15 yards of material to make 7 jackets. did you buy enough material? if not, how much were you over or under?
Answers: 1
Mathematics, 22.06.2019 02:40
Arestaurant manager wanted to get a better understanding of the tips her employees earn, so she decided to record the number of patrons her restaurant receives over the course of a week, as well as how many of those patrons left tips of at least 15%. the data she collected is in the table below. day mon tue wed thu fri sat sun patrons 126 106 103 126 153 165 137 tippers 82 87 93 68 91 83 64 which day of the week has the lowest experimental probability of patrons tipping at least 15%? a. sunday b. saturday c. friday d. thursday
Answers: 1
You know the right answer?
The following dot plot represents a random sample of elementary students and the number of children...
Questions


English, 05.11.2019 13:31
Mathematics, 05.11.2019 13:31

Biology, 05.11.2019 13:31
Mathematics, 05.11.2019 13:31


Business, 05.11.2019 13:31
English, 05.11.2019 14:31

Engineering, 05.11.2019 14:31

Social Studies, 05.11.2019 14:31

Chemistry, 05.11.2019 14:31


