dont have to answer all
Wendell is designing the layout of the backyard behind his new ho...

Mathematics, 08.04.2020 22:54 gin9
dont have to answer all
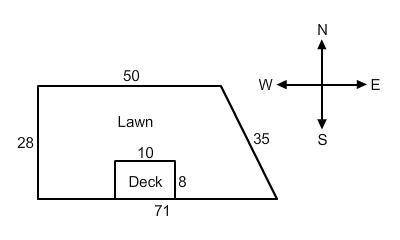
Wendell is designing the layout of the backyard behind his new home. He wants to build a dog house and add some flower gardens. In the following tasks, you will help Wendell create a scale drawing of his backyard to help him plan the location and size of the dog house and gardens. The provided sketch is not drawn to scale, but it does give the actual dimensions of the lawn in feet. The backyard is a trapezoid—the west side is perpendicular to both the north and south sides, and the deck is a rectangle.
In the scale drawing, what will the length of the east side of the backyard be?
in the scale drawing, what will the length of the south side of the backyard be?
In the scale drawing, what will the length of the west side of the backyard be?
In the scale drawing, what will the length of the north side of the backyard be?
Two corners of the backyard are right angles. The third corner forms an obtuse angle measuring 127º. The fourth corner forms an acute angle measuring 53º. When transferring these angle measurements from the real world to the scale drawing, will their measures increase, decrease, or stay the same?

Answers: 1
Another question on Mathematics
Mathematics, 21.06.2019 15:50
3-12. write each answer with a reasonable number of figures. find the absolute uncertainty and percent relative uncertainty for each answer. (a) [12.41 (±0.09) + 4.16 (±0.01)] x 7.068 2 (±0.000 4) =? (b) [3.26 (±0.10) x 8.47 (±0.05)] - 0.18 (±0.06) =? (c) 6.843 (±0.008) x 104 + [2.09 (±0.04)- 1.63 (±0.01)] =?
Answers: 1
Mathematics, 21.06.2019 17:00
Evaluate the expression for the given value of the variable 7a - 4a for a =8
Answers: 2
Mathematics, 21.06.2019 19:30
We just started the introduction into circles and i have no idea how to do this.
Answers: 3
Mathematics, 21.06.2019 23:00
The equation shown below represents function f. f(x)= -2x+5 the graph shown below represents function g. which of the following statements is true? a. over the interval [2, 4], the average rate of change of f is the same as the average rate of change of g. the y-intercept of function f is less than the y-intercept of function g. b. over the interval [2, 4], the average rate of change of f is greater than the average rate of change of g. the y-intercept of function f is greater than the y-intercept of function g. c. over the interval [2, 4], the average rate of change of f is the same as the average rate of change of g. the y-intercept of function f is greater than the y-intercept of function g. d. over the interval [2, 4], the average rate of change of f is less than the average rate of change of g. the y-intercept of function f is the same as the y-intercept of function g.
Answers: 1
You know the right answer?
Questions


History, 24.02.2020 09:04


Health, 24.02.2020 09:05

World Languages, 24.02.2020 09:12
Mathematics, 24.02.2020 09:14
Mathematics, 24.02.2020 09:14
Mathematics, 24.02.2020 09:15


