
Mathematics, 08.04.2020 16:20 ale1910
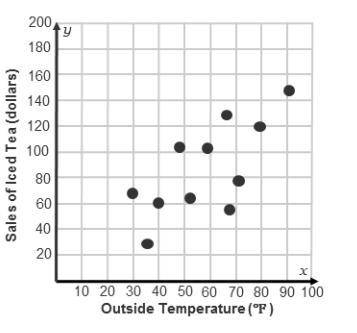
A graph has outside Temperature (degrees Fahrenheit) on the x-axis, and sales of iced tea (dollars) on the y-axis. Points are at (30, 69), (71, 78), (37, 30), (48, 103), (40, 60), (80, 120), (92, 145).
Which two points should the trend line go through to best represent the data given in this scatterplot?
(30, 69) and (71, 78)
(37, 30) and (48, 103)
(40, 60) and (71, 78)
(40, 60) and (80,120)

Answers: 3
Another question on Mathematics
Mathematics, 21.06.2019 16:10
20 da is equal to a. 2,000 cm. b. 2 m. c. 20,000 cm. d. 20,000 mm
Answers: 1
Mathematics, 21.06.2019 22:30
There are 93 calories in a small candy bar how many calories are ther in a half dozen small candy bars?
Answers: 2
Mathematics, 21.06.2019 23:40
Klmn and pqrs are similar trapezoids. which side of pqrs corresponds to lm
Answers: 1
Mathematics, 22.06.2019 00:30
Will mark ! (10 points also! ) if x varies inversely with y and x =6 when y= 10, find y when x=8 a. y=4.8 b. y=7.5 c. y=40/3 d. y=4/15
Answers: 1
You know the right answer?
A graph has outside Temperature (degrees Fahrenheit) on the x-axis, and sales of iced tea (dollars)...
Questions

English, 27.08.2021 21:50
Mathematics, 27.08.2021 21:50

English, 27.08.2021 21:50
Mathematics, 27.08.2021 21:50
Mathematics, 27.08.2021 21:50


Mathematics, 27.08.2021 21:50

Mathematics, 27.08.2021 21:50


