
Mathematics, 03.02.2020 21:50 shelbylynn17
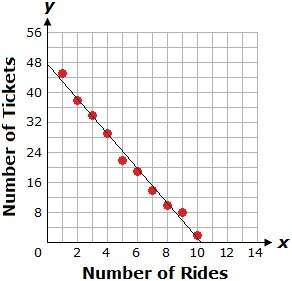
The graph below shows a line of best fit for the relationship between the number of tickets that brittany has and the number of rides she goes on at the state fair. different rides require different amounts of tickets.
the line of best fit used to model the data is shown below.
y = -4.64x + 47.6
which of the following statements is true for the above graph?
a.
the slope means that for every three tickets, brittany goes on 14 rides.
b.
the y-intercept means that brittany will run out of tickets after going on about 48 rides.
c.
the slope means that for every three rides, brittany uses about 14 tickets.
d.
the y-intercept means that brittany spent $48 on tickets.

Answers: 2
Another question on Mathematics
Mathematics, 21.06.2019 16:40
The graph of which equation includes the points (0, 10) and (10, 11)? y = 10x + 11 y = x + 10 y= 1/10x + 10 y = 1/10x + 11
Answers: 1
Mathematics, 21.06.2019 17:00
Omar is going on a road trip! the car rental company offers him two types of cars. each car has a fixed price, but he also needs to consider the cost of fuel. the first car costs $90 to rent, and because of its fuel consumption rate, there's an additional cost of s0.50 per kilometer driven.
Answers: 2
Mathematics, 21.06.2019 17:30
25 ! the line of best fit is h = 5a + 86. predict the height at age 16. show your work.
Answers: 1
You know the right answer?
The graph below shows a line of best fit for the relationship between the number of tickets that bri...
Questions
Mathematics, 07.10.2019 23:10


Geography, 07.10.2019 23:10

Computers and Technology, 07.10.2019 23:10


