
(06.02)
the table below shows data for a class's mid-term and final exams:
mid-te...

Mathematics, 20.10.2019 19:20 izabellehannah7165
(06.02)
the table below shows data for a class's mid-term and final exams:
mid-term final
96 100
95 85
92 85
90 83
87 83
86 82
82 81
81 78
80 78
78 78
73 75
which data set has the smallest iqr? (1 point)
they have the same iqr
mid-term exams
final exams
there is not enough information
2. (06.02)
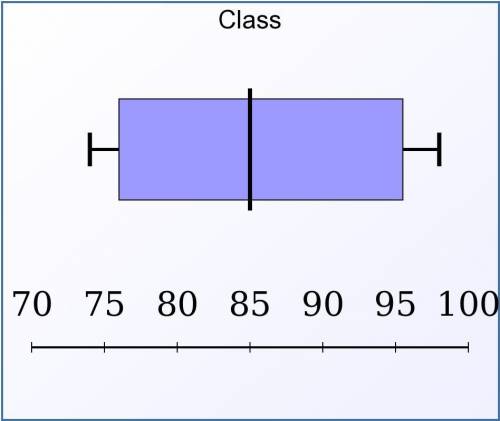
the box plots below show student grades on the most recent exam compared to overall grades in the class:
two box plots shown. the top one is labeled class. minimum at 74, q1 at 78, median at 85, q3 at 93, maximum at 98. the bottom b
which of the following best describes the information about the medians? (1 point)
the exam median is only 1–2 points higher than the class median.
the exam median is much higher than the class median.
the additional scores in the second quartile for the exam data make the median higher.
the narrower range for the exam data causes the median to be higher.
3. (06.02)
the box plots below show attendance at a local movie theater and high school basketball games:
two box plots shown. the top one is labeled movies. minimum at 60, q1 at 65, median at 95, q3 at 125, maximum at 150. the botto
which of the following best describes how to measure the spread of the data? (1 point)
the iqr is a better measure of spread for movies than it is for basketball games.
the standard deviation is a better measure of spread for movies than it is for basketball games.
the iqr is the best measurement of spread for games and movies.
the standard deviation is the best measurement of spread for games and movies.
4. (06.02)
the box plots below show the average daily temperatures in april and october for a u. s. city:
two box plots shown. the top one is labeled april. minimum at 50, q1 at 60, median at 67, q3 at 71, maximum at 75. the bottom b
what can you tell about the means for these two months? (1 point)
the mean for april is higher than october's mean.
there is no way of telling what the means are.
the low median for october pulls its mean below april's mean.
the high range for october pulls its mean above april's mean.
5. (06.02)
the table below shows data from a survey about the amount of time high school students spent reading and the amount of time spent watching videos each week (without reading):
reading video
5 1
5 4
7 7
7 10
7 12
12 15
12 15
12 18
14 21
15 26
which response best describes outliers in these data sets? (2 points)
neither data set has suspected outliers.
the range of data is too small to identify outliers.
video has a suspected outlier in the 26-hour value.
due to the narrow range of reading compared to video, the video values of 18, 21, and 26 are all possible outliers.
6. (06.02)
male and female high school students reported how many hours they worked each week in summer jobs. the data is represented in the following box plots:
two box plots shown. the top one is labeled males. minimum at 0, q1 at 1, median at 20, q3 at 25, maximum at 50. the bottom box
identify any values of data that might affect the statistical measures of spread and center. (2 points)
the females worked less than the males, and the female median is close to q1.
there is a high data value that causes the data set to be asymmetrical for the males.
there are significant outliers at the high ends of both the males and the females.
both graphs have the required quartiles.
7. (06.02)
the table below shows data from a survey about the amount of time students spend doing homework each week. the students were either in college or in high school:
high low q1 q3 iqr median mean σ
college 50 6 8.5 17 8.5 12 15.4 11.7
high school 28 3 4.5 15 10.5 11 10.5 5.8
which of the choices below best describes how to measure the spread of this data? (2 points)
both spreads are best described with the iqr.
both spreads are best described with the standard deviation.
the college spread is best described by the iqr. the high school spread is best described by the standard deviation.
the college spread is best described by the standard deviation. the high school spread is best described by the iqr.

Answers: 3
Another question on Mathematics
Mathematics, 21.06.2019 16:30
The temperature of chicken soup is 192.7°f. as it cools, the temperature of the soup decreases 2.3°f per minute. what is the temperature in degrees fahrenheit of the soup after 25 minutes? a. 27.3°f b. 57.5°f c. 135.2°f d. 250.2°f
Answers: 1
Mathematics, 21.06.2019 16:50
The rate of decay of a radioactive substance depends upon the amount present initially. the mass y (mg) of the radioactive substance cobalt-60 present in a sample at time t (years) is represented by the exponential equation y=50e −0.1315 t . answer the following questions in complete sentences. 1. how does the exponential equation above compare to the equation for simple interest that is compounded continuously? explain the similarities. 2. what is the initial amount of cobalt-60 in the sample? 2. how much cobalt-60 is left after 8.4 years? show your work. 3. what would be the y-intercept of the graph? what does it represent? 4. after how many years will the amount of cobalt-60 left be 6.25 mg? explain what happens to the cobalt-60 after 50 years? 5. discuss some “real-world” examples and uses of cobalt-60
Answers: 1
Mathematics, 21.06.2019 19:00
What is the expression in factored form? -20x^2 - 12x a. 4x(5x+3) b. -4x(5x-3) c. -4(5x+3) d. -4x(5x+3)
Answers: 2
Mathematics, 21.06.2019 20:30
The sum of these consecutive integers is equal to 9 less than 4 times the least of the integer. find the three integers
Answers: 1
You know the right answer?
Questions

Spanish, 05.11.2020 07:40

History, 05.11.2020 07:40
Mathematics, 05.11.2020 07:40


Biology, 05.11.2020 07:40
History, 05.11.2020 07:40
Mathematics, 05.11.2020 07:40

Physics, 05.11.2020 07:40
Mathematics, 05.11.2020 07:40
Mathematics, 05.11.2020 07:40

Mathematics, 05.11.2020 07:40
SAT, 05.11.2020 07:40
Mathematics, 05.11.2020 07:40


