
History, 23.03.2021 02:10 sclifton2014
Study the graph about immigration.
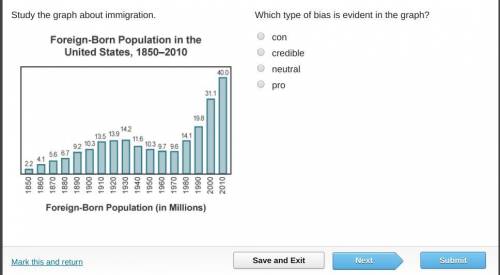
A bar graph titled Foreign-Born Population in the United States from 1850 to 2010. The x-axis is labeled Foreign-Born Population in millions from years 1850 to 2010. 1850 is 2.2. 1890 is 9.2. 1920 is 13.9. 1930 is 14.2. 1950 is 10.3. 1990 is 19.8. 2010 is 40.
Which type of bias is evident in the graph?
con
credible
neutral
pro

Answers: 1
Another question on History
History, 22.06.2019 00:30
10 points which of the following was not included in the declaration of sentiments at the seneca falls convention? a) women's right to practice religion freely b) women's right to be guardians of their own children c) women's right to own property d) women's right to speak wherever they chooseth
Answers: 3
History, 22.06.2019 03:30
Is the weather changing? consider the data of severe weather that includes tornadoes occurring throughout the u. s. over the last four years. compare the severe weather for the last three years. then compare the first three months of 2017 with that data. based on previous years, what might the prediction be for weather during 2017?
Answers: 1
History, 22.06.2019 04:10
Look at the graph. where p is price and q is quantity, what might cause a move from b to a?
Answers: 1
You know the right answer?
Study the graph about immigration.
A bar graph titled Foreign-Born Population in the United States...
Questions


English, 21.08.2019 23:50

Mathematics, 21.08.2019 23:50
English, 21.08.2019 23:50
History, 21.08.2019 23:50

Social Studies, 21.08.2019 23:50
English, 21.08.2019 23:50
History, 21.08.2019 23:50
Physics, 21.08.2019 23:50
History, 21.08.2019 23:50


