Analyze the charts below and answer the question that follows.
Economic Sectors in Austr...

Social Studies, 29.05.2020 02:57 nikki987654
Analyze the charts below and answer the question that follows.
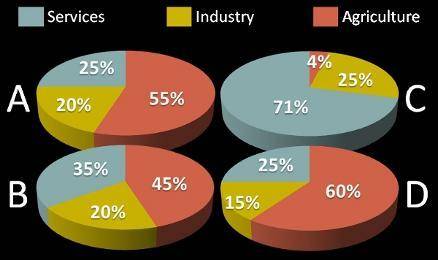
Economic Sectors in Australia (by GDP)
Four pie charts titled Economic Sectors of New Zealand (G D P). Chart A is 25 percent Services, 20 percent Industry, 55 percent Agriculture. Chart B is 35 percent Services, 20 percent Industry, 45 percent Agriculture. Chart C is 71 percent Services, 25 percent Industry, 4 percent Agriculture. Chart D is 25 percent Services, 15 percent Industry, 60 percent Agriculture.
Data courtesy of the CIA World Factbook, 2010
Which of the pie charts above accurately depicts the GDP composition by sector of Australia?
A. Chart A
B. Chart B
C. Chart C
D. Chart D

Answers: 2
Another question on Social Studies
Social Studies, 22.06.2019 01:00
Identify how the virginia declaration of rights lead to an expansion of civil rights both in the states of virginia and, later in the entire united states
Answers: 2
Social Studies, 22.06.2019 22:50
How did ancient civilizations develope its agriculture and protect its population
Answers: 3
Social Studies, 23.06.2019 05:20
4. write short introduction to aaran and jaanto technology.
Answers: 2
You know the right answer?
Questions


History, 30.11.2020 22:10

History, 30.11.2020 22:10
History, 30.11.2020 22:10


History, 30.11.2020 22:10

Mathematics, 30.11.2020 22:10

English, 30.11.2020 22:10

Spanish, 30.11.2020 22:10


