The chart compares the price of graphic T-shirts to the quantity demanded.
This chart sh...

SAT, 09.03.2020 02:53 dxnimxriee
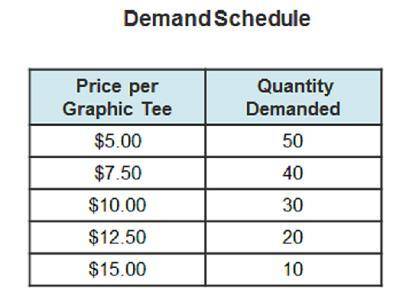
The chart compares the price of graphic T-shirts to the quantity demanded.
This chart shows the link between
interest in a product and the price a consumer pays.
interest in a product and the price a producer pays.
amount of a product and the price a consumer pays.
amount of a product and the price a producer pays.
Answers: 3
Another question on SAT
SAT, 24.06.2019 08:30
Why should children should be allowed to vote at elections? explain
Answers: 2
SAT, 24.06.2019 09:40
Alaser tag arena sells two types of memberships. one package costs $325 for one year of membership with an unlimited number of visits. the second package has $125 enrollment fee, includes five free visits, and costs and additional $8 per visit after the first five. how many visits would a person need to use for each type of membership to cost the same amount over a one-year period?
Answers: 2
SAT, 25.06.2019 22:00
These two squirrels live in the same ecosystem. what type of interaction do the images represent? a. direct competition b. mutualism c. interference competition d. symbiotic e. indirect competition
Answers: 1
SAT, 27.06.2019 06:00
Guys plz and say a best answer i will give 15 points how we should prepare for a scholarship exam
Answers: 2
You know the right answer?
Questions


History, 06.03.2020 23:35


