
Physics, 25.01.2022 01:40 Naysa150724
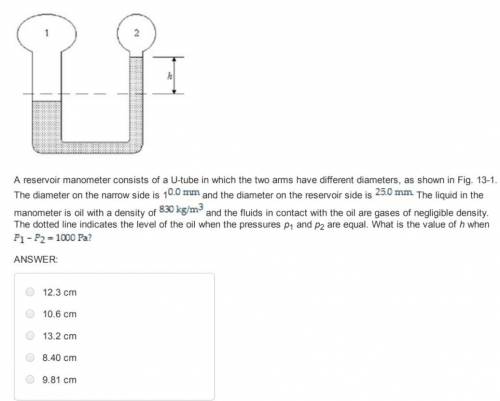
A reservoir manometer consists of a Utube in which the two arms have different diameters, as shown in Fig. 131. The diameter on the narrow side is 10.0 mm and the diameter on the reservoir side is 25.0 mm. The liquid in the manometer is oil with a density of 830 km/m-3 and the fluids in contact with the oil are gases of negligible density. The dotted line indicates the level of the oil when the pressures p1 and p2 are equal. What is the value of h when p1-p2=1000?

Answers: 2
Another question on Physics
Physics, 22.06.2019 01:30
Use the frequency histogram to complete the following parts. ​(a) identify the class with the​ greatest, and the class with the​ least, relative frequency. ​(b) estimate the greatest and least relative frequencies. ​(c) describe any patterns with the data. female fibula lengths 30.5 31.5 32.5 33.5 34.5 35.5 36.5 37.5 38.5 39.5 0 0.05 0.1 0.15 0.2 0.25 length (in centimeters) relative frequency a histogram titled "female fibula lengths" has a horizontal axis labeled "length in centimeters" from 30.5 to 39.5 in increments of 1 and a vertical axis labeled "relative frequency" from 0 to 0.25 in increments of 0.05. the histogram contains vertical bars of width 1, where one vertical bar is centered over each of the horizontal axis tick marks. the approximate heights of the vertical bars are listed as follows, where the label is listed first and the approximate height is listed second: 30.5, 0.02; 31.5, 0.04; 32.5, 0.05; 33.5, 0.13; 34.5, 0.22; 35.5, 0.25; 36.5, 0.13; 37.5, 0.06; 38.5, 0.09; 39.5, 0.01. ​(a) the class with the greatest relative frequency is nothing to nothing centimeters. ​(type integers or decimals. do not round. use ascending​ order.)
Answers: 3
Physics, 22.06.2019 12:30
Urgent pls a. coal consumption levels off and remains flat. b. petroleum, natural gas, and renewables show an increase in consumption c. more nonrenewable resources continued to be consumed than renewable. d. there is little projected increase in nuclear energy use. e. carbon dioxide emissions are projected to decline as we approach 2040. global energy consumption is defined as the total energy used by an individual or organizations from around the world. use the graph above to analyze the projected energy consumption from now until 2040. which statements in the prompt apply? a) a, b, d b) b, c, d c) a, c, d d) a, b, c, d
Answers: 1
Physics, 22.06.2019 15:20
Acarpenter builds an exterior house wall with a layer of wood 2.9 cm thick on the outside and a layer of styrofoam insulation 2.3 cm thick on the inside wall surface. the wood has k=0.080w/(m⋅k), and the styrofoam has k= 0.010 w/(m⋅k). the interior surface temperature is 19.0 ∘c , and the exterior surface temperature is -15.0 ∘c . a.)what is the temperature at the plane where the wood meets the styrofoam? celsius b.)what is the rate of heat flow per square meter through this wall? /m^2
Answers: 2
Physics, 22.06.2019 17:40
Scientists follow specific processes in order to determine valid explanations and conclusions from observations. david observed strange lights in the sky above his home outside of roswell, new mexico. the only explanation that makes sense to him is that there are ufos in the area. what should david do next to verify his explanation?
Answers: 1
You know the right answer?
A reservoir manometer consists of a Utube in which the two arms have different diameters, as shown...
Questions

English, 05.07.2019 22:30

Mathematics, 05.07.2019 22:30

Mathematics, 05.07.2019 22:30

Social Studies, 05.07.2019 22:30

Health, 05.07.2019 22:30
Mathematics, 05.07.2019 22:30
Mathematics, 05.07.2019 22:30

Computers and Technology, 05.07.2019 22:30
Mathematics, 05.07.2019 22:30
Health, 05.07.2019 22:30


