
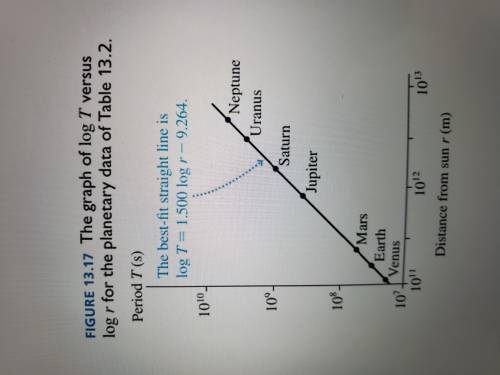
Figure 13.17 showed a graph of log T versus log r for the planetary
data given in Table 13.2. Such a graph is called a log-log graph.
The scales in Figure 13.17 are logarithmic, not linear, meaning
that each division along the axis corresponds to a factor of 10
increase in the value. Strictly speaking, the “correct” labels on the
y-axis should be 7, 8, 9, and 10 because these are the logarithms of
107
,c,1010
.
a. Consider two quantities u and v that are related by the expression
v p = Cuq
, where C is a constant. The exponents p and q are
not necessarily integers. Define x = log u and y = log v. Find
an expression for y in terms of x.
b. What shape will a graph of y versus x have? Explain.
c. What slope will a graph of y versus x have? Explain.
d. Use the experimentally determined “best-fit” line in Figure 13.17
to find the mass of the sun.

Answers: 3
Another question on Physics
Physics, 22.06.2019 02:30
Eddy whose mass is 55kg climbs up the 1.50 meter high stairs in 2s.calculate eddy’s power rating
Answers: 1
Physics, 22.06.2019 16:00
The frequency of the fundamental of the guitar string is 320 hz. at what speed v do waves move along that string?
Answers: 2
Physics, 22.06.2019 17:20
Which is not true of the intertropical convergence zone? a) it features heavy precipitation b) it's where the trade winds collidec) it's a high-pressure zone with sinking air d) it is also known as the doldrums
Answers: 2
Physics, 22.06.2019 20:40
Abasketball star covers 2.65 m horizontally in a jump to dunk the ball. his motion through space can be modeled precisely as that of a particle at his center of mass. his center of mass is at elevation 1.02 m when he leaves the floor. it reaches a maximum height of 1.90 m above the floor and is at elevation 0.910 m when he touches down again. (a) determine his time of flight (his "hang time"). (b) determine his horizontal velocity at the instant of takeoff. (c) determine his vertical velocity at the instant of takeoff. (d) determine his takeoff angle. (e) for comparison, determine the hang time of a whitetail deer making a jump with center-of-mass elevations yi = 1.20 m, ymax = 2.45 m, and yf = 0.750 m.
Answers: 1
You know the right answer?
Figure 13.17 showed a graph of log T versus log r for the planetary
data given in Table 13.2. Such...
Questions


Advanced Placement (AP), 30.06.2019 07:00

Mathematics, 30.06.2019 07:00

Mathematics, 30.06.2019 07:00
Mathematics, 30.06.2019 07:00
Mathematics, 30.06.2019 07:00
Mathematics, 30.06.2019 07:00

Health, 30.06.2019 07:00
Mathematics, 30.06.2019 07:00

History, 30.06.2019 07:00
Health, 30.06.2019 07:00
Mathematics, 30.06.2019 07:00
Mathematics, 30.06.2019 07:00
History, 30.06.2019 07:00
Mathematics, 30.06.2019 07:00


