
Physics, 12.03.2021 01:30 jacksonsmith0
Help will give 15 points
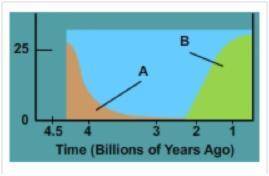
In graph two, label A represents the gases hydrogen sulfide, methane, and carbon dioxide. What gases are represented by label B and how do these gas levels relate to the evolution of photosynthetic organisms?
Description of Graph:
The graph depicts the percentages of oxygen and carbon dioxide in Earth's atmosphere over time. The x-axis shows time in billions of years, and the y-axis shows percentages. Two curved lines depict the changing values of oxygen and carbon dioxide in the Earth's atmosphere over that time, but the lines are labeled with the variables "A" and "B."
The line labeled with the variable "A" depicts a substance with a percentage starting just above twenty five percent at 4.3 billion years ago. The percentage of this substance in the atmosphere decreases to about five percent by 4 billion years ago, and reaches a steady value of about one percent from 3.5 billion years ago to the end of the graph. The line depicting the second substance, labeled with the variable "B," appears around 2.3 billion years ago. It grows from zero to five percent by 2 billion years ago. The percentage of substance B in the atmosphere increases steadily, passing 20 percent by 1.5 billion years ago and leveling out at around 30 percent by 1 billion years ago.

Answers: 3
Another question on Physics
Physics, 22.06.2019 05:10
Total solidification times of three casting geometries are to be compared: a sphere, a cylinder, in which the length-to-diameter ration - 1.0, and a cube. volume = 1000 cm^3 for all three shhapes, and the same casting alloy is used. a) determine the solidification times of each geometry b) based on the results of part (a), which geometric element would make the best riser? c) if the mold constant = 3.5 min/cm^2 in chvorinov's rule, compute the total solidification time for each casting.
Answers: 3
Physics, 22.06.2019 12:30
Brades exam guidelines exam instructions billing & payments & support question 6 of 20 : select the best answer for the question use this illustration to answer the question below. forms & resources al programs 9 ww linics 6. in the circuit shown in the figure above, suppose that the value of r, is 100k, and the value of r2 is 470 kq. at which of the following locations in the circuit would you measure the highest voltage with your meter? rvices 999999 a. between points b and c b. between points a and b c. between points b and e d. between points a and c eredu mark for review (will be highlighted on the review page) mend < < previous question next question
Answers: 1
Physics, 22.06.2019 17:50
Which of the following best describes internal energy? a. the difference between the kinetic and potential energies of the particles in a system b. the sum of the kinetic and potential energies of the particles in a system c. the sum of the kinetic and thermal energies of the particles in a system d. the difference between the kinetic and thermal energies of the particles in a system
Answers: 2
Physics, 22.06.2019 22:00
Four friends, a, b, c, and d are standing varying distances away from a speaker which is producing sound waves.
Answers: 2
You know the right answer?
Help will give 15 points
In graph two, label A represents the gases hydrogen sulfide, methane, and...
Questions

Mathematics, 17.12.2020 04:10

Mathematics, 17.12.2020 04:10


English, 17.12.2020 04:10


Health, 17.12.2020 04:10


