
Physics, 27.10.2020 22:50 akeelahbolton4
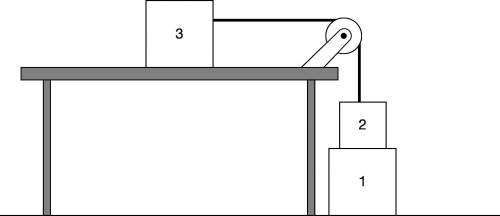
The figure presents a diagram of three blocks, labeled 1 through 3. In the diagram, block 1 is resting on the floor. Block 2, which is smaller than block 1, is resting on top of block 1. Block 3, which is approximately the same size as block 1, is resting on a table. The right side of block 3 is attached to one end of a string which runs over a pulley located at the right edge of the table. The other end of the string is attached to the top of block 2.
Block 1 is resting on the floor with block 2 at rest on top of it. Block 3, at rest on a smooth table with negligible friction, is attached to block 2 by a string that passes over a pulley, as shown above. The string and pulley have negligible mass.
(a)
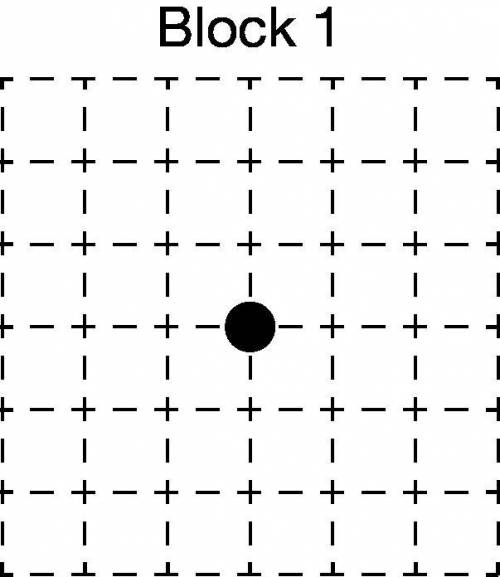
i. On the dot that represents block 1, draw and label the forces (not components) exerted on block 1. Each force must be represented by a distinct arrow starting on, and pointing away from, the dot. Draw the relative lengths of all arrows to reflect the relative magnitudes of the forces.
The figure presents a 6 by 6 grid with a dot in the center, labeled “Block 1.”
Question 2
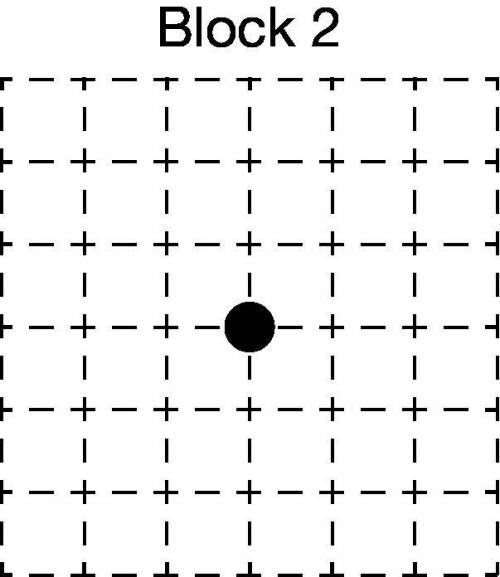
ii. On the dot that represents block 2, draw and label the forces (not components) exerted on block 2. Each force must be represented by a distinct arrow starting on, and pointing away from, the dot. Draw the relative lengths of all arrows to reflect the relative magnitudes of the forces.
The figure presents a 6 by 6 grid with a dot in the center, labeled “Block 2.”
Question 3
(b) Block 1 is removed without disturbing block 2.
i. Consider the scenario where the mass m3 of block 3 is greater than the mass m2 of block 2. Without using equations, make a claim about the motion of block 3 in terms of balanced or unbalanced forces.
Block 3 will move to the right because friction is negligible so Fg would move block 2 down and therefore, tension would pull block 3.
Question 4
ii. Derive an equation for the acceleration of block 3 for any arbitrary values of m3 and m2. Express your answer in terms of m3, m2, and physical constants as appropriate.
Question 5
(c) Describe in what way your answer to part (b)(ii) is or is not consistent with your claim in part (b)(i).
It is consistent with bi because the block3 will be moving to the right.
Question 6
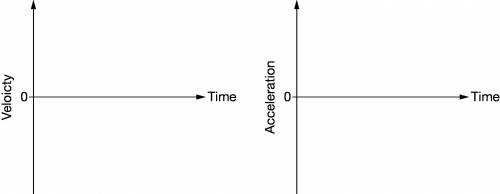
(d) On the axes below, sketch graphs of the velocity and the acceleration of block 2 after block 1 has been removed. Take the time to be zero immediately after block 1 has been removed.

Answers: 3
Another question on Physics
Physics, 21.06.2019 22:00
Atank holds 1000 gallons of water, which drains from the bottom of the tank in half an hour. the values in the table show the volume v of water remaining in the tank (in gallons) after t minutes.t(min) 5 10 15 20 25 30v(gal) 694 444 250 111 28 0(a) if p is the point (15, 250) on the graph of v, find the slopes of the secant lines pq when q is the point on the graph with t = 5, 10, 20, 25, and 30.(b) estimate the slope of the tangent line at p by averaging the slopes of two secant lines.(c) use a graph of the function to estimate the slope of the tangent line at p. (this slope represents the rate at which the water is flowing from the tank after 15 minutes.)show all steps.
Answers: 2
Physics, 22.06.2019 04:10
Unpolarized light of intensity so passes through two sheets of polarizing material whose transmission axes make an angle of 60∘ with each other as shown in the figure. what is the intensity of the transmitted beam, st?
Answers: 3
Physics, 22.06.2019 08:00
Why is it important always to use horizontal bars in unit fractions when performing unit conversions?
Answers: 3
Physics, 22.06.2019 23:00
As seen in a us weather map, the h (or high) and l (or low) symbols indicate regions where surface air pressures are high or low, respectively, compared to surrounding areas. an h is plotted where the air pressure is highest and an l is plotted where the air pressure is lowest. proceeding outward and away from the center of a high pressure system, the air pressure "
Answers: 1
You know the right answer?
The figure presents a diagram of three blocks, labeled 1 through 3. In the diagram, block 1 is resti...
Questions


Geography, 13.10.2019 07:50
Mathematics, 13.10.2019 07:50

English, 13.10.2019 07:50

History, 13.10.2019 07:50

Computers and Technology, 13.10.2019 07:50
Mathematics, 13.10.2019 07:50

Chemistry, 13.10.2019 07:50
History, 13.10.2019 07:50
History, 13.10.2019 07:50


