
Physics, 31.08.2020 21:01 quokkamokka97
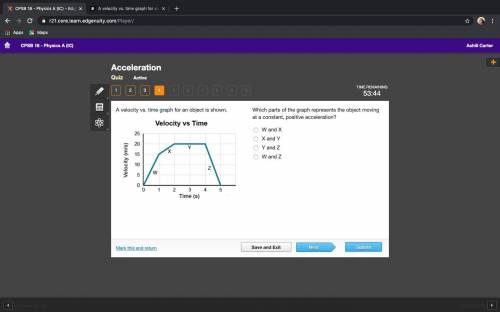
A velocity vs. time graph for an object is shown. A graph titled Velocity versus Time shows time in seconds on the x axis, numbered 0 to 5, Velocity in meters per second on the y axis, numbered 0 to 25. A line labeled W starts at the origin and ends at (1, 15). A line labeled X starts at (1, 15) and ends at (2, 20). A line labeled Y starts at (2, 20) and ends at (4, 20). A line labeled Z starts at (4, 20) and ends at (5, 0). Which parts of the graph represents the object moving at a constant, positive acceleration? W and X X and Y Y and Z W and Z

Answers: 2
Another question on Physics
Physics, 21.06.2019 13:10
Asmall blob of putty of mass m falls from the ceiling and lands on the outer rim of a turntable of radius r and moment of inertia i0 that is rotating freely with angular speed ω0 about its vertical fixed-symmetry axis. (use any variable or symbol stated above as necessary.)
Answers: 2
Physics, 21.06.2019 21:30
How many seconds does it take a pebble released from rest off a bridge to fall 29.4 m ? what is the pebble's speed when it has fallen 29.4 m ?
Answers: 1
Physics, 21.06.2019 23:30
To do work, this truck uses energy stored in chemical fuel and an electrical battery. how much total energy does this truck put out?
Answers: 1
Physics, 22.06.2019 02:10
Which statement correctly describes the relationship between frequency and wavelength?
Answers: 2
You know the right answer?
A velocity vs. time graph for an object is shown. A graph titled Velocity versus Time shows time in...
Questions


Biology, 26.06.2019 03:30
English, 26.06.2019 03:30


