Which statements accurately describe the graph? check all that apply.
the dependent variable,...

Physics, 20.08.2019 18:30 billyeyelash
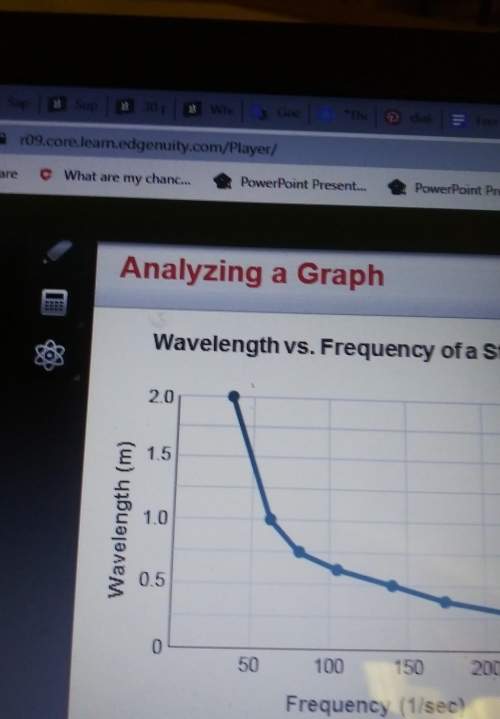
Which statements accurately describe the graph? check all that apply.
the dependent variable, frequency, is placed on the horizontal axis.
the intervals on each axis are evenly spaced.
the vertical axis is labeled "wavelength" and uses meters for units.
a smooth curve is drawn through the data points.
a best-fit line is drawn through the data points.

Answers: 3
Another question on Physics
Physics, 22.06.2019 06:00
An object moves from position +34m to the position -15m in 15 seconds. what is the total displacement? what is the total velocity?
Answers: 3
Physics, 22.06.2019 21:20
Would it be correct to say the doppler effect is the apparent change in the speed of a wave due to the motion of the source? be sure to fully explain your position using at least 3 complete content related sentences.
Answers: 3
You know the right answer?
Questions


History, 24.07.2019 00:00

Physics, 24.07.2019 00:00

Chemistry, 24.07.2019 00:00
Mathematics, 24.07.2019 00:00

History, 24.07.2019 00:00

Advanced Placement (AP), 24.07.2019 00:00


English, 24.07.2019 00:00


