 . Substituting the data into the calculator we get the equation:
  .
.
 . According to the calculator, the exponential regression equation is
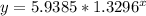

Nstructions:
view the video found on page 1 of this journal activity.
using the i...

Mathematics, 12.11.2019 02:31 erinwebsterrr
Nstructions:
view the video found on page 1 of this journal activity.
using the information provided in the video, answer the questions below.
show your work for all calculations.
here are the data for the hypothetical (or imagined) rabbit population.
year (x) 0 1 2 3 4 5 6 7 8 9 10
number of rabbits (y) 6 8 10 14 19 25 33 43 57 77 104
1. looking at the data, does this rabbit growth look linear, quadratic, or exponential? explain your answer.
(1 point)
2. make a scatterplot for the data. (2 points)
3. looking at the scatterplot, which regression model do you think fits the data? explain your answer.
(1 point)
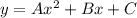
4. using a graphing calculator, find the quadratic regression equation for the rabbit data.
(2 points: 1 point for identifying constants, 1 for the equation)
5. using the quadratic regression equation from question 4, predict the number of rabbits in year 70.
(2 points: 1 point for setting up the correct equation, 1 for simplifying)
6. using a graphing calculator, find the exponential regression equation for the rabbit data.
(2 points: 1 point for identifying the constants, 1 for the equation)
7. using the exponential regression equation from question 6, predict the number of rabbits in year 70.
(2 points: 1 point for setting up the correct equation, 1 for simplifying)
8. compare the predicted number of rabbits for year 70 using the quadratic model (question 5) with the predicted number using the exponential model (question 7). which prediction is larger? (1 point)
9. is it reasonable to use this data set to predict the hypothetical number of rabbits for year 70? explain.
(1 point)
making a decision
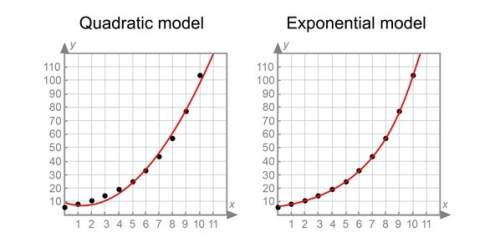
10. these graphs show the scatterplot with the quadratic regression equation and the exponential regression equation.
a) which do you think is a better fit? why? (2 points: 1 point for choice, 1 point for explanation)
b) how does your answer to part (a) compare with your guess about the best model in question 1? was your initial choice correct? (1 point)
analyze your results
11. the video says there were an estimated 10 billion rabbits in australia after 70 years.
a) how does your predicted number of rabbits for the hypothetical population compare with the actual rabbit population in australia in year 70? (1 point)
b) why do you think the rabbit population in australia can grow so large? (1 point)
c) what are some factors that might prevent a rabbit population from growing infinitely large? (1 point)
prompt
rabbits are cute, aren't they? [an image of a rabbit appears.] but they can have lots of cute babies, and it's not long before the babies start having babies . .
[a green image of australia appears.]
in 1859, an australian had 24 wild rabbits shipped to the land down under. [small rabbits begin to pop up on the image of australia and cover it entirely.] within 70 years, there were an estimated 10 billion rabbits in australia. that's billion . . with a b. it's an ecological disaster they're still dealing with.
so, how do we model growth like this mathematically? here's some hypothetical data that grow a lot like the australian rabbit population did. [a table showing the population of rabbits per year is shown]. the rabbit population is getting larger and larger, but is this growth linear? or would a different model work better?

Answers: 1
Another question on Mathematics
Mathematics, 21.06.2019 15:10
Which of the following is a justification used while proving the similarity of triangles lom and mon
Answers: 1
Mathematics, 21.06.2019 20:40
Which function has an inverse function? a.f(x)= |x+3|/5 b. f(x)= x^5-3 c. f(x)= x^4/7+27 d. f(x)= 1/x²
Answers: 1
Mathematics, 22.06.2019 03:00
You coordinate volunteers for litter cleanup in local parks. your spreadsheet lists drivers and the number of seat belts in each driver’s car. the spreadsheet calculates the number of drivers (d) and the total number of seat belts (s). you want to know the maximum number of volunteers, besides drivers, that can be transported to the park in a single trip given that each person must have a seat belt of their own.
Answers: 2
You know the right answer?
Questions


Geography, 20.03.2021 17:40


Physics, 20.03.2021 17:40

World Languages, 20.03.2021 17:40

Mathematics, 20.03.2021 17:40
English, 20.03.2021 17:40
Mathematics, 20.03.2021 17:50

Mathematics, 20.03.2021 17:50
Mathematics, 20.03.2021 17:50


