Question
your assignment: coffee shop prices
choosing a model
you are your boss,...

Mathematics, 20.09.2019 18:50 kalbaugh
Question
your assignment: coffee shop prices
choosing a model
you are your boss, the owner of a coffee shop, set prices. she has gathered some data by counting the number of cups sold per day at various prices. your job is to see if there is a relationship between price and sales for one of the two most popular drinks.
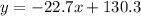
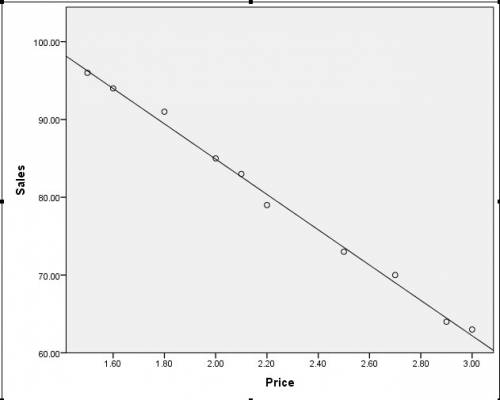
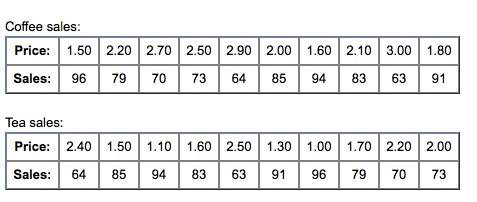
coffee sales:
price: 1.50 2.20 2.70 2.50 2.90 2.00 1.60 2.10 3.00 1.80
sales: 96 79 70 73 64 85 94 83 63 91
tea sales:
price: 2.40 1.50 1.10 1.60 2.50 1.30 1.00 1.70 2.20 2.00
sales: 64 85 94 83 63 91 96 79 70 73
1. which drink did you select? circle one.
coffeetea
find a line of best fit.
2. enter the data into your calculator and perform a linear regression. round a and b to the nearest tenth. (2 points: 1 point for slope and 1 point for y-value of y-intercept)
what is your linear regression equation?
3. what is the meaning of the slope? (2 points)
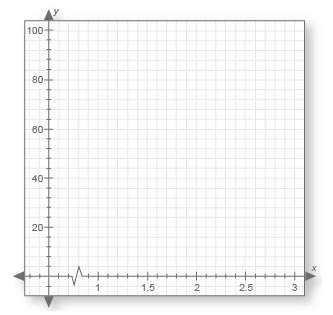
4. create a scatterplot for your beverage using the data from the table. then graph the linear regression equation you found in question 2. (4 points)
5. does the line of best fit seem like a good model for the data? why or why not? (2 points)
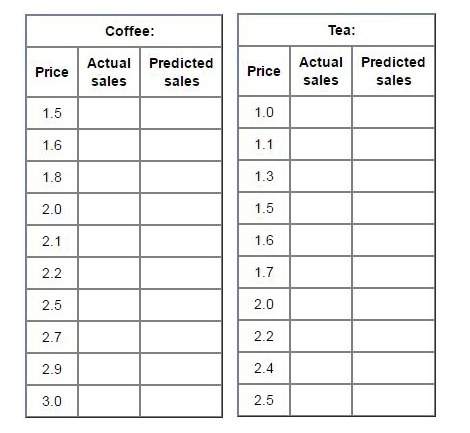
6. complete the table. (10 points: 1 point for each row)
identify the actual number of sales at each price.
use your line of best fit to calculate the predicted sales at each price.
prompt
on-screen text:
coffee shop prices
a begin button starts the animation.
[click "begin."]
on-screen text:
you are your boss, the owner of a coffee shop, set prices. she has gathered some data by counting the number of cups sold per day at various prices. your job is to see if there is a relationship between price and sales for one of the two most popular drinks. will you choose coffee or tea?
which will you choose?
[two images of mugs are shown: one filled with coffee and surrounded by coffee beans, and the other filled with tea, with a sprig of mint next to the mug.]
[click "coffee."] great! you will look at coffee sales. use the data in the table to find the line of best fit. then evaluate your model.
[a table with two sets of data is shown.]
price: 1.50, 2.20, 2.70, 2.50, 2.90, 2.00, 1.60, 2.10, 3.00, 1.80
sales: 96, 79, 70, 73, 64, 85, 94, 83, 63, 91
[click "tea."] great! you will look at tea sales. use the data in the table to find the line of best fit. then evaluate your model.
[a table with two sets of data is shown.]
price: 2.40, 1.50, 1.10, 1.60, 2.50, 1.30, 1.00, 1.70, 2.20, 2.00
sales: 64, 85, 94, 83, 63, 91, 96, 79, 70, 73

Answers: 1
Another question on Mathematics
Mathematics, 21.06.2019 18:30
The length of a rectangle is x times the square root of 100. the width is one-half y more than three-halves x. given that the area of the rectangle is 125 cm2, which equation could represent the rectangle in terms of x and y? a) 5xy − 15x = 125 b) 5xy + 15x = 125 c) 15x2 − 5xy = 125 d) 15x2 + 5xy = 125
Answers: 2
Mathematics, 21.06.2019 20:30
What is 1/3x5 on anuber line what does it look like on a number line
Answers: 3
You know the right answer?
Questions
Mathematics, 18.11.2020 01:40
Mathematics, 18.11.2020 01:40

Chemistry, 18.11.2020 01:40


SAT, 18.11.2020 01:40
Mathematics, 18.11.2020 01:40
Mathematics, 18.11.2020 01:40
Mathematics, 18.11.2020 01:40

Spanish, 18.11.2020 01:40
Mathematics, 18.11.2020 01:40


