
Mathematics, 27.07.2019 03:30 gavergan
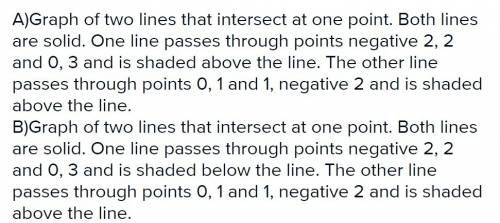
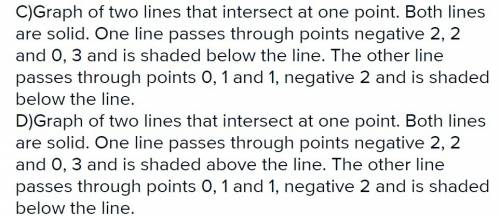
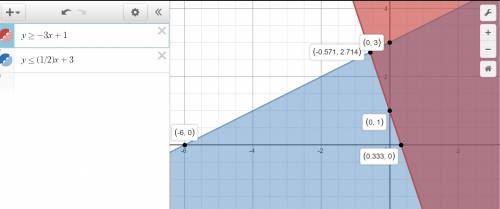
Choose the graph below that represents the following system of inequalities: y ≥ −3x + 1 y ≤ 1 over 2x + 3

Answers: 1
Another question on Mathematics
Mathematics, 20.06.2019 18:02
Ineed with this. the figure is made up of a square and a rectangle. find the area of the shaded region.
Answers: 3
Mathematics, 21.06.2019 20:30
Create a question with this scenario you could ask that could be answered only by graphing or using logarithm. david estimated he had about 20 fish in his pond. a year later, there were about 1.5 times as many fish. the year after that, the number of fish increased by a factor of 1.5 again. the number of fish is modeled by f(x)=20(1.5)^x.
Answers: 1
Mathematics, 21.06.2019 21:50
Which of the following is the graph of y= square root -x-3
Answers: 1
Mathematics, 21.06.2019 22:00
18 16 11 45 33 11 33 14 18 11 what is the mode for this data set
Answers: 2
You know the right answer?
Choose the graph below that represents the following system of inequalities: y ≥ −3x + 1 y ≤ 1 over...
Questions


Mathematics, 26.06.2020 16:01


Mathematics, 26.06.2020 16:01
Mathematics, 26.06.2020 16:01


