
Mathematics, 28.07.2019 05:00 gyexisromero10
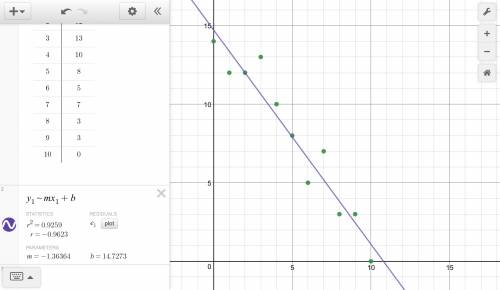
Ascatter plot is shown: a graph shows numbers from 0 to 10 on the x axis at increments of 1 and the numbers 0 to 15 on the y axis at increments of 1. the ordered pairs 0, 14 and 1, 12 and 2, 12 and 3, 13 and 4, 10 and 5, 8 and 6, 5 and 7, 7 and 8, 3 and 9, 3 and 10, 0 are shown on the graph which two ordered pairs can be joined to draw the best line of best fit for this scatterplot? (0, 15) and (10, 1) (0, 15) and (10, 13) (0, 10) and (5, 0) (0, 10) and (10, 10)

Answers: 1
Another question on Mathematics
Mathematics, 21.06.2019 15:30
Click on the y intercept. -x +4 i know you cant click on it so could you just say the coordinates like (example - (1,0) you so much.
Answers: 2
Mathematics, 21.06.2019 21:30
Design an er diagram for keeping track of information about votes taken in the u.s. house of representatives during the current two-year congressional session. the database needs to keep track of each u.s. state's name (e.g., texas', new york', california') and include the region of the state (whose domain is {northeast', midwest', southeast', southwest', west'}). each congress person in the house of representatives is described by his or her name, plus the district represented, the start date when the congressperson was first elected, and the political party to which he or she belongs (whose domain is {republican', democrat', 'independent', other'}). the database keeps track of each bill (i.e., proposed law), including the bill name, the date of vote on the bill, whether the bill passed or failed (whose domain is {yes', no'}), and the sponsor (the congressperson(s) who sponsored - that is, proposed - the bill). the database also keeps track of how each congressperson voted on each bill (domain of vote attribute is {yes', no', abstain', absent'}). additional information:
Answers: 1
Mathematics, 21.06.2019 22:00
Find two numbers if their sum is 91 and the ratio is 6: 7?
Answers: 1
Mathematics, 21.06.2019 23:00
Which radical expression is a rational number? a. √ 360 b. √ 644 c. √ 225 d. √ 122
Answers: 1
You know the right answer?
Ascatter plot is shown: a graph shows numbers from 0 to 10 on the x axis at increments of 1 and the...
Questions

History, 10.12.2019 03:31
Mathematics, 10.12.2019 03:31

Spanish, 10.12.2019 03:31
Mathematics, 10.12.2019 03:31
History, 10.12.2019 03:31


Social Studies, 10.12.2019 03:31

Geography, 10.12.2019 03:31
Mathematics, 10.12.2019 03:31
Social Studies, 10.12.2019 03:31
Mathematics, 10.12.2019 03:31

Biology, 10.12.2019 03:31
Mathematics, 10.12.2019 03:31


