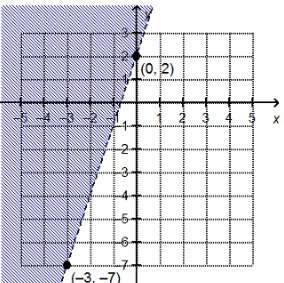
The graph is represented by the inequality y>3x+2
Step-by-step explanation:
Linear inequality is like linear equation just we have inequality signs (<,>,≤,≥) instead of equal sign(=).
In the given question we have the linear inequality represented by graph
We can see the line in the graph passing through the point (-3,-7)
Let's check which option satisfy the point
1) y<3x+2 for this the line should be y=3x+2
⇒ -7=3(-3)+2
⇒-7= -9+2⇒-7=-7,which is true.
2) y>3x+2 which similar as first.
3) y<x+2 for this the line should be y=x+2
⇒ -7= -3+2
⇒-7=-1 which is not true.
4) y > x + 2 is similar to third.
Option 3) and 4) cannot be the required linear inequality.
Now from 1) and 2) , 2) should be the required linear inequality as the graph is shaded above the line and that must be for y (>) greater than inequality. [ for y (<) less than inequality the graph must be shaded below the line]
Therefore, 2) y > 3x + 2 is the required linear inequality which is represented by the graph.