35
the scatter plot shows the relationship betweeen the number of hours students spend watchi...

Mathematics, 05.10.2019 15:00 peytonhause20
35
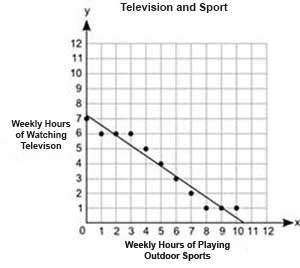
the scatter plot shows the relationship betweeen the number of hours students spend watching television and the numer of hours they spend playing outdoor sports each week.
a graph is titled television and sport. on the x axis, the label is weekly hours of
what is the y-intercept of the line of best fit and what does it represent?
a 10.4 hours; the number of hours students play outdoor sports in a week when they do not watch television
b 7.2 hours; the number of hours students play outdoor sports in a week when they do not watch television
c 10.4 hours; the number of hours students watch television in a week when they do not participate in any outdoor sports
d 7.2 hours; the number of hours students watch television in a week when they do not participate in any outdoor sports

Answers: 2
Another question on Mathematics
Mathematics, 21.06.2019 19:00
Marina baked cookies. she gave 3/4 of the cookies to the scout bake sale. she shared the remaining 6 cookies with her friends. how many cookies did marina bake?
Answers: 3
Mathematics, 21.06.2019 21:40
Many newspapers carry a certain puzzle in which the reader must unscramble letters to form words. how many ways can the letters of emdangl be arranged? identify the correct unscrambling, then determine the probability of getting that result by randomly selecting one arrangement of the given letters.
Answers: 1
Mathematics, 22.06.2019 03:30
Find the sixth term of the following geometric sequence.
Answers: 1
You know the right answer?
Questions

Mathematics, 13.01.2021 17:10
Mathematics, 13.01.2021 17:10

Computers and Technology, 13.01.2021 17:10


Social Studies, 13.01.2021 17:10
Mathematics, 13.01.2021 17:10
Mathematics, 13.01.2021 17:10


