
Mathematics, 05.07.2019 19:40 brayannnnn36781
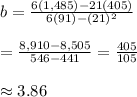
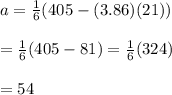
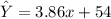
Using simple linear regression, calculate the trend line for the historical data. say the x axis is april = 1, may = 2, and so on, while the y axis is demand. (round your intercept value to the nearest whole number and slope value to 2 decimal places.

Answers: 1
![\begin{tabular} {|c|c|} &Demand\\[1ex] April&60\\ May&55\\ June&75\\July&60\\August&80\\September&75\\ \end{tabular}](/tpl/images/0055/2053/78ffe.png)

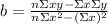
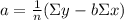
![\begin{tabular} {|c|c|c|c|} X &Y&X^2&XY\\[1ex] 1&60&1&60\\ 2&55&4&110\\ 3&75&9&225\\ 4&60&16&240\\ 5&80&25&400\\ 6&75&36&450\\[1ex] \Sigma X=21&\Sigma Y=405&\Sigma X^2=91&\Sigma XY=1,485 \end{tabular}](/tpl/images/0055/2053/0846b.png)
Another question on Mathematics
Mathematics, 21.06.2019 18:00
Aculture started with 3000 bacteria. after 5 hours it grew to 3900 bacteria. predict how many bacteria will be present after 9 hours
Answers: 3
Mathematics, 21.06.2019 18:30
Find the exact value of each of the following. in each case, show your work and explain the steps you take to find the value. (a) sin 17π/6 (b) tan 13π/4 (c) sec 11π/3
Answers: 2
Mathematics, 21.06.2019 19:30
The volume of a cube-shaped shipping container is 13,824 cubic inches. find the edge length of the shipping container.
Answers: 1
Mathematics, 21.06.2019 20:30
East black horse $0.25 total budget is $555 it'll cost $115 for other supplies about how many flyers do you think we can buy
Answers: 1
You know the right answer?
Using simple linear regression, calculate the trend line for the historical data. say the x axis is...
Questions
Mathematics, 05.03.2021 19:10

Law, 05.03.2021 19:10


Mathematics, 05.03.2021 19:10
Mathematics, 05.03.2021 19:10
Mathematics, 05.03.2021 19:10
Mathematics, 05.03.2021 19:10
Mathematics, 05.03.2021 19:10
Mathematics, 05.03.2021 19:10
Mathematics, 05.03.2021 19:10


Mathematics, 05.03.2021 19:10
Mathematics, 05.03.2021 19:10


