
Mathematics, 16.02.2022 21:10 Masonb1849
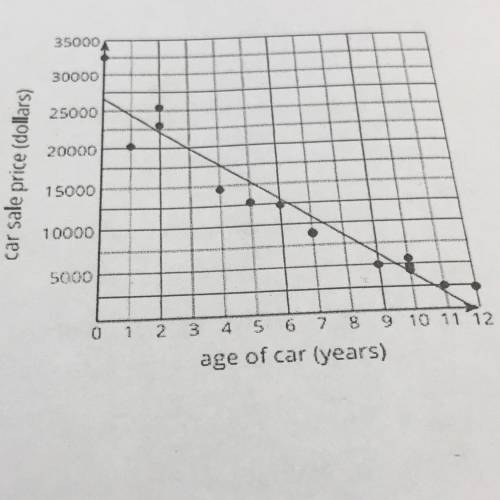
3. A local car salesperson created a scatter plot to display the
relationship between a car's sale price in dollars, y, and the age of
the carin years, x. The equation of the line that models the data in
the scatter plot is given by y = -2500x + 26000. This equation is
shown in the scatter plot.
a. where in the equation do you see the slope? what does it represent?
b. where in the graph do you see the y-intercept?what does it represent?
c. ava said the slope of the line -2500 and that it describes the rate at which the age of the car is decreasing. why is she inccorrect?
d. danielle explained that the older cars are more expensive? do you dissagree or agree?

Answers: 3
Another question on Mathematics
Mathematics, 21.06.2019 17:30
25 ! the line of best fit is h = 5a + 86. predict the height at age 16. show your work.
Answers: 1
Mathematics, 21.06.2019 17:30
Arefrigeration system at your company uses temperature sensors fixed to read celsius (°c) values, but the system operators in your control room understand only the fahrenheit scale. you have been asked to make a fahrenheit (°f) label for the high temperature alarm, which is set to ring whenever the system temperature rises above –10°c. what fahrenheit value should you write on the label
Answers: 1
Mathematics, 21.06.2019 18:30
[10 points, algebra 2-simplifying complex fractions]according to my answer key the restrictions are -1 and 4. but why not positive 1?
Answers: 1
Mathematics, 21.06.2019 21:40
In a survey of 1015 adults, a polling agency asked, "when you retire, do you think you will have enough money to live comfortably or not. of the 1015 surveyed, 534 stated that they were worried about having enough money to live comfortably in retirement. construct a 90% confidence interval for the proportion of adults who are worried about having enough money to live comfortably in retirement.
Answers: 3
You know the right answer?
3. A local car salesperson created a scatter plot to display the
relationship between a car's sale...
Questions


History, 21.10.2020 19:01
Physics, 21.10.2020 19:01

English, 21.10.2020 19:01
History, 21.10.2020 19:01
Physics, 21.10.2020 19:01

Chemistry, 21.10.2020 19:01
Mathematics, 21.10.2020 19:01

Advanced Placement (AP), 21.10.2020 19:01

Computers and Technology, 21.10.2020 19:01
Business, 21.10.2020 19:01


