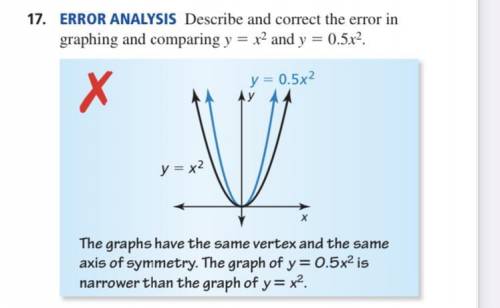
ERROR ANALYSIS Describe and correct the error in
graphing and comparing
y= x^2and y = 0.5x^...

Mathematics, 12.02.2022 08:50 20heldmadison
ERROR ANALYSIS Describe and correct the error in
graphing and comparing
y= x^2and y = 0.5x^2.

Answers: 2
Another question on Mathematics
Mathematics, 21.06.2019 12:40
The price of a particular stock is represented by the linear equation , where x represents the number of weeks the stock has been owned and y represents the price of the stock, in dollars. if this relationship continues, what is the price of the stock after it has been owned for 12 weeks? $92.55 $94.37 $100.52 $114.39
Answers: 3
Mathematics, 21.06.2019 13:30
Ben wants to play a carnival game that costs $2. in his pocket he has 5 red tickets worth 35 cents each, and 15 blue tickets worth 10 cents each. which of the following systems of inequalities correctly represents the constraints on the variables in this problem? let represent the red tickets and b represent the blue tickets.
Answers: 2
Mathematics, 21.06.2019 16:00
Part one: measurements 1. measure your own height and arm span (from finger-tip to finger-tip) in inches. you will likely need some from a parent, guardian, or sibling to get accurate measurements. record your measurements on the "data record" document. use the "data record" to you complete part two of this project. name relationship to student x height in inches y arm span in inches archie dad 72 72 ginelle mom 65 66 sarah sister 64 65 meleah sister 66 3/4 67 rachel sister 53 1/2 53 emily auntie 66 1/2 66 hannah myself 66 1/2 69 part two: representation of data with plots 1. using graphing software of your choice, create a scatter plot of your data. predict the line of best fit, and sketch it on your graph. part three: the line of best fit include your scatter plot and the answers to the following questions in your word processing document 1. 1. which variable did you plot on the x-axis, and which variable did you plot on the y-axis? explain why you assigned the variables in that way. 2. write the equation of the line of best fit using the slope-intercept formula $y = mx + b$. show all your work, including the points used to determine the slope and how the equation was determined. 3. what does the slope of the line represent within the context of your graph? what does the y-intercept represent? 5. use the line of best fit to you to describe the data correlation.
Answers: 2
Mathematics, 21.06.2019 16:50
Suppose that the price p (in dollars) and the weekly sales x (in thousands of units) of a certain commodity satisfy the demand equation 4p cubedplusx squaredequals38 comma 400. determine the rate at which sales are changing at a time when xequals80, pequals20, and the price is falling at the rate of $.20 per week.
Answers: 3
You know the right answer?
Questions


Mathematics, 30.07.2019 09:20
Social Studies, 30.07.2019 09:20
Social Studies, 30.07.2019 09:20
History, 30.07.2019 09:20


