PLEASE HELP!
The diagram represents triangle ABC with angle measures 55°, 80°, and X
Q...

Mathematics, 11.02.2022 14:00 nsaleh567
PLEASE HELP!
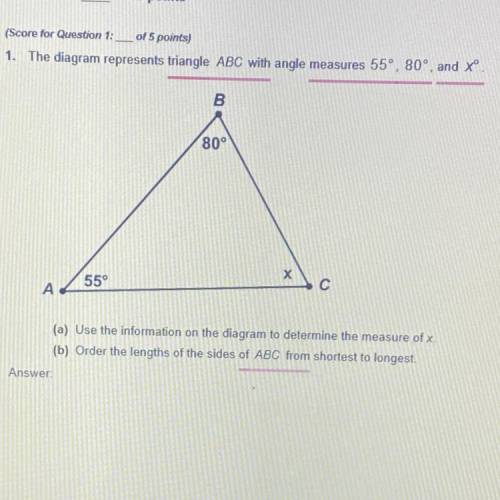
The diagram represents triangle ABC with angle measures 55°, 80°, and X
Question (a) Use the information on the diagram to determine the measure of x.
Question (b) Order the lengths of the sides of ABC from shortest to longest.

Answers: 2
Another question on Mathematics
Mathematics, 21.06.2019 13:00
Which of the following system of equation is not equal to the system of equations is not equal to the system of equations shown below
Answers: 3
Mathematics, 21.06.2019 13:40
Cam bought some used books for $4.95. he paid $0.50 each for some books and $0.35 each for the others. he bought fewer than 8 books at each price. how many books did cam buy?
Answers: 1
Mathematics, 21.06.2019 21:30
*let m∠cob = 50°30’, m∠aob = 70° and m∠aoc = 20°30’. could point c be in the interior of ∠aob? why? a. point c could be the interior of aob but it is not the only case b. point c is the interior of aob c. point c is not the interior of aob d. the given is not possible for the plane geometry answer
Answers: 1
Mathematics, 22.06.2019 02:30
Atrain traveled for 1.5 hours to the first station, stopped for 30 minutes, then traveled for 4 hours to the final station where it stopped for 1 hour. the total distance traveled is a function of time. which graph most accurately represents this scenario? a graph is shown with the x-axis labeled time (in hours) and the y-axis labeled total distance (in miles). the line begins at the origin and moves upward for 1.5 hours. the line then continues upward at a slow rate until 2 hours. from 2 to 6 hours, the line continues quickly upward. from 6 to 7 hours, it moves downward until it touches the x-axis a graph is shown with the axis labeled time (in hours) and the y axis labeled total distance (in miles). a line is shown beginning at the origin. the line moves upward until 1.5 hours, then is a horizontal line until 2 hours. the line moves quickly upward again until 6 hours, and then is horizontal until 7 hours a graph is shown with the axis labeled time (in hours) and the y-axis labeled total distance (in miles). the line begins at the y-axis where y equals 125. it is horizontal until 1.5 hours, then moves downward until 2 hours where it touches the x-axis. the line moves upward until 6 hours and then moves downward until 7 hours where it touches the x-axis a graph is shown with the axis labeled time (in hours) and the y-axis labeled total distance (in miles). the line begins at y equals 125 and is horizontal for 1.5 hours. the line moves downward until 2 hours, then back up until 5.5 hours. the line is horizontal from 5.5 to 7 hours
Answers: 1
You know the right answer?
Questions

Mathematics, 22.03.2021 19:20
Mathematics, 22.03.2021 19:20


Physics, 22.03.2021 19:20

Social Studies, 22.03.2021 19:20


Biology, 22.03.2021 19:20

History, 22.03.2021 19:20
Mathematics, 22.03.2021 19:20
Mathematics, 22.03.2021 19:20
Mathematics, 22.03.2021 19:20
Physics, 22.03.2021 19:20


