
Mathematics, 08.01.2022 01:00 kasey59
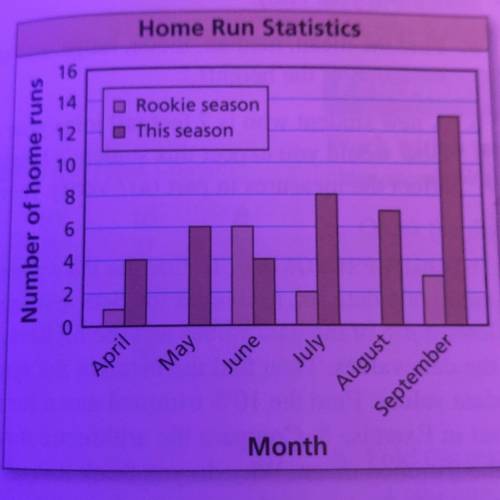
18. ANALYZING DATA The graph shows a player's
monthly home run totals in two seasons. Find the
range of the number of home runs for each season, .
.
Compare your results.
Home Run Statistics
16
14
Rookie season
This season
12
10
Number of home runs
00
8
6
4
2
NO
April
May
June
July
August
September
Month

Answers: 1
Another question on Mathematics
Mathematics, 21.06.2019 15:30
Will mark brainliest if you answer ! the taco shop sold 198 lunches friday. this number is 3 more than 3 times the number they sold monday. let n represent the number of lunches sold monday. which equation shows an equality between two different ways of expressing the number of lunches sold on friday? a. n – 3 = 198 b. 3n – 3 = 198 c. 3n + 3 = 198 d. n + 3 = 198
Answers: 1
Mathematics, 21.06.2019 18:00
If f(x) = 4x – 3 and g(x) = 8x + 2, find each function value a.f[g(3)] b.g[f(5)] c.g{f[g(-4)]}
Answers: 3
Mathematics, 21.06.2019 19:00
What are the solutions of the equation? z^2 + 11z + 24 = 0 a. 8, -3 b. 8, 3 c. -8, -3 d. -8, 3
Answers: 2
Mathematics, 22.06.2019 00:00
At a local museum, the total price for one adult and one child is $11. mrs. smith paid for herself and her three children. she spent $19. record the system of equations to be solved and then find the price of an adult and child ticket using either elimination or substitution.
Answers: 1
You know the right answer?
18. ANALYZING DATA The graph shows a player's
monthly home run totals in two seasons. Find the
Questions
Mathematics, 06.06.2020 16:58


Spanish, 06.06.2020 16:58


Mathematics, 06.06.2020 16:58


Computers and Technology, 06.06.2020 16:58


