
Mathematics, 15.12.2021 03:00 lorrainelopez
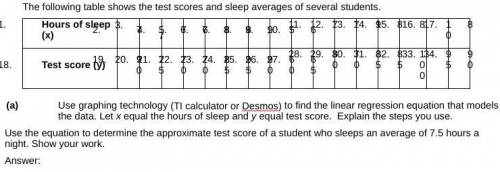
Use graphing technology (TI calculator or Desmos) to find the linear regression equation that models the data. Let x equal the hours of sleep and y equal test score. Explain the steps you use. Use the equation to determine the approximate test score of a student who sleeps an average of 7.5 hours a night. Show your work. Please no bots, nonsense answers, or links unless they are actually helpful)

Answers: 1
Another question on Mathematics
Mathematics, 21.06.2019 18:10
which of the following sets of data would produce the largest value for an independent-measures t statistic? the two sample means are 10 and 20 with variances of 20 and 25 the two sample means are 10 and 20 with variances of 120 and 125 the two sample means are 10 and 12 with sample variances of 20 and 25 the two sample means are 10 and 12 with variances of 120 and 125
Answers: 2
Mathematics, 21.06.2019 19:30
The standard deviation for a set of data is 5.5. the mean is 265. what is the margin of error?
Answers: 3
Mathematics, 21.06.2019 23:30
Abaseball team drinks 10/4 gallons of water during a game. which mixed number represents the gallons of water consumed? a) 1 1/2 gallons b) 2 1/2 gallons c) 2 3/4 gallons d) 3 1/2 gallons
Answers: 2
You know the right answer?
Use graphing technology (TI calculator or Desmos) to find the linear regression equation that models...
Questions

Social Studies, 27.02.2021 03:00


Chemistry, 27.02.2021 03:00
Chemistry, 27.02.2021 03:00

Biology, 27.02.2021 03:00
Mathematics, 27.02.2021 03:00
Mathematics, 27.02.2021 03:00

History, 27.02.2021 03:00
Mathematics, 27.02.2021 03:00


