
Mathematics, 13.12.2021 07:20 oliviahopebigel
POSSIBLE POINTS 33 33
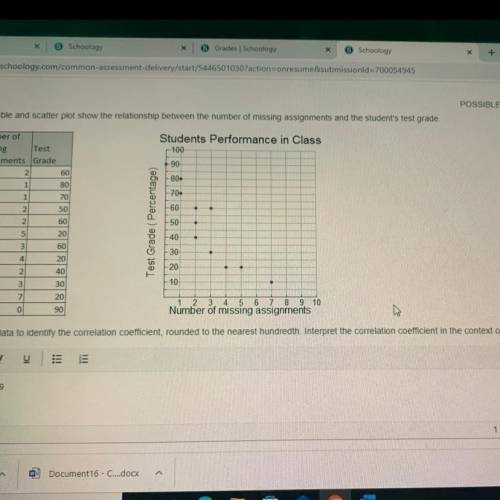
The table and scatter plot show the relationship between the number of missing assignments and the student's test grade
Students Performance in Class
100
90
-80-
-70
-60
Number of
missing
Test
assignments Grade
2
60
1
80
1
70
2 50
2
60
5
20
3
60
4
20
2
40
3 30
7
20
0
90
Test Grade (Percentage)
50
-40
30
20
10
1 3 4 5 6 7 8 10
Number of missing assignments
Use the data to identify the correlation coefficient, rounded to the nearest hundredth. Interpret the correlation coefficient in the context of the situation,
B
1
IC
iii
TII

Answers: 1
Another question on Mathematics
Mathematics, 21.06.2019 14:30
What are the relative frequencies, to the nearest hundredth, of the rows of the two-way table? group 1: a 15 b 45 group 2: a 20 b 25
Answers: 3
Mathematics, 21.06.2019 17:00
Mary beth used the mapping rule to find the coordinates of a point that had been rotated 90° counterclockwise around the origin. examine the steps to determine whether she made an error. m (3, –6) is rotated 90° counterclockwise. (x, y) → (–y, x) 1. switch the x- and y-coordinates: (6, –3) 2. multiply the new x-coordinate by –1: (6(–1), –3) 3. simplify: (–6, –3) .
Answers: 1
Mathematics, 21.06.2019 19:30
Can someone me with the property questions for 12 13 and 14 plz
Answers: 2
Mathematics, 21.06.2019 21:30
The expression 1.01*1.005(^t) gives the amount of money, in thousands of dollars, in carter's savings account (t) years after he opens it. what does 1.01 represent in this expression?
Answers: 1
You know the right answer?
POSSIBLE POINTS 33 33
The table and scatter plot show the relationship between the number of missi...
Questions

Mathematics, 14.07.2021 19:10

History, 14.07.2021 19:10
Mathematics, 14.07.2021 19:10

Computers and Technology, 14.07.2021 19:10

Chemistry, 14.07.2021 19:10

Chemistry, 14.07.2021 19:10


