
Mathematics, 10.12.2021 20:10 raieliz1414
Бір-9292 2, onio BoЯ - ЯНІ
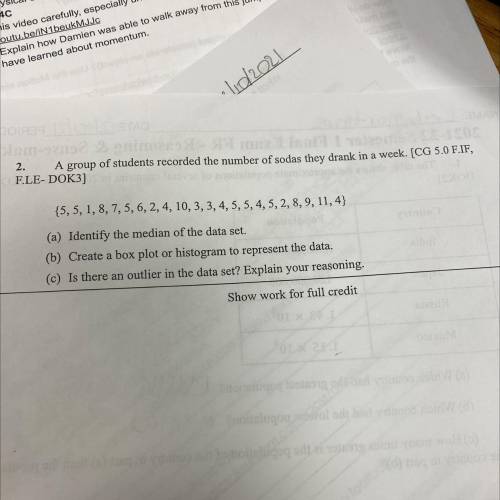
A group of students recorded the number of sodas they drank in a week. [CG 5.0 F. IF,
F. LE- DOK3]
2.
{5, 5, 1, 8, 7, 5, 6, 2, 4, 10, 3, 3, 4, 5, 5, 4, 5, 2, 8, 9, 11,4}
molto
(a) Identify the median of the data set.
(b) Create a box plot or histogram to represent the data.
© Is there an outlier in the data set? Explain your reasoning.
CAN SOMEONE PLS HELP ME

Answers: 3
Another question on Mathematics
Mathematics, 21.06.2019 16:00
Which fraction is not equivalent to 8/12 a. 2/3 b. 24/36 c. 4/10 d. 6/10
Answers: 1
Mathematics, 21.06.2019 18:50
If sr is 4.5cm and tr is 3cm, what is the measure in degrees of angle s?
Answers: 2
Mathematics, 22.06.2019 01:20
Aprobability experiment is conducted in which the sample space of the experiment is s={7,8,9,10,11,12,13,14,15,16,17,18}, event f={7,8,9,10,11,12}, and event g={11,12,13,14}. assume that each outcome is equally likely. list the outcomes in f or g. find p(f or g) by counting the number of outcomes in f or g. determine p(f or g) using the general addition rule.
Answers: 2
You know the right answer?
Бір-9292 2, onio BoЯ - ЯНІ
A group of students recorded the number of sodas they drank in a week....
Questions


Health, 25.06.2019 01:10
Mathematics, 25.06.2019 01:10
Mathematics, 25.06.2019 01:10

English, 25.06.2019 01:10
Mathematics, 25.06.2019 01:10
Mathematics, 25.06.2019 01:10
Mathematics, 25.06.2019 01:10

Mathematics, 25.06.2019 01:10

Mathematics, 25.06.2019 01:10


