
Mathematics, 07.12.2021 18:00 MysteryDove12
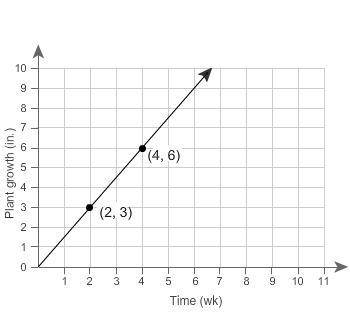
Relationship B has a lesser rate than Relationship A. This graph represents Relationship A.
What table could represent Relationship B?
Time (weeks) 3 6 8 10
Plant growth (in.) 4.8 9.6 12.8 16
Time (weeks) 3 4 6 9
Plant growth (in.) 5.4 7.2 10.8 16.2
Time (weeks) 3 4 6 9
Plant growth (in.) 6.3 8.4 12.6 18.9
Please give explanation ands how your work so I can understand on how you got that answer.
This graph is down below

Answers: 2
Another question on Mathematics
Mathematics, 21.06.2019 17:30
Nine more than four times a number is the same as one less than twice the number. find the number?
Answers: 1
Mathematics, 21.06.2019 23:30
Find each value of the five-number summary for this set of data. [note: type your answers as numbers. do not round.] 150, 120, 136, 180, 158, 175, 124, 162 minimum maximum median upper quartile lower quartile
Answers: 1
Mathematics, 21.06.2019 23:30
What is the area of a triangle with a base of 7x and height of 8x expressed as a monomial? question 5 options: 1x 15x2 28x2 56x2
Answers: 1
You know the right answer?
Relationship B has a lesser rate than Relationship A. This graph represents Relationship A.
What t...
Questions


Biology, 28.08.2019 18:00

Health, 28.08.2019 18:00


Computers and Technology, 28.08.2019 18:00
Mathematics, 28.08.2019 18:00

Chemistry, 28.08.2019 18:00
Social Studies, 28.08.2019 18:00
Chemistry, 28.08.2019 18:00


Social Studies, 28.08.2019 18:00
Mathematics, 28.08.2019 18:00
Mathematics, 28.08.2019 18:00
Mathematics, 28.08.2019 18:00


