
Mathematics, 04.11.2021 14:00 hailey5129
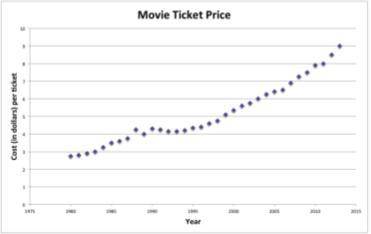
It can be expensive to go to the movie theater. The scatter plot shown here gives the average cost in U. S. dollars of a movie ticket in the U. S. for each year from 1980 to 2013. Using this data, how much do you think a movie ticket will cost in the years 2020 and 2030? Download the worksheet and complete.
1. How has the cost of a movie ticket changed over the last 30 years? What has been the general trend? How can you tell this from the graph?
2. What years did the cost of movie ticket decrease compared to the year before? How can you tell from the graph when the price is decreasing?
3. There was a time where the cost of a movie ticket stayed relatively the same over several years. For what years did the cost stay relatively the same? How can you tell this from the graph?
4. The graph could be divided up into three different periods of relatively consistent ticket price
change: The years 1980 – 1988, 1989 – 1993 and 1994 – 2011. Can you find a typical rate of change in the price of a ticket for each of these time periods? In other words, on average, by how much did the price of a ticket increase by each year during each of these time periods?
5. Predict the cost of a ticket in 2012 – 2015. Plot your predictions and give your actual predictions for each year below. How did you determine how much a ticket would cost each year?
6. What might have been the cost of a ticket during the years 1975 – 1979? Plot your estimates on the grid and give your actual predictions for each year below. How did you determine how much a ticket would cost each year?
7. Find a line of best fit to represent the data. Let y = ticket price and x = the number of years since 1980 (1980 is year zero, 1981 is year one). Approximate a line to represent the data, a slope, a y-intercept and equation that models your line of best fit.
8. Use your equation (or graph or a table) to predict the cost of a movie ticket in the years 2020 and 2030. Be sure to show how you came to each answer.

Answers: 2

Another question on Mathematics
Mathematics, 21.06.2019 16:40
Which of the following is the correct equation for this function? a. y= (x+4)(x+2) b. y=x^2+ 3x – 2 c. y+ 2 = – 2(x+3)^2 d. y+ 2 = 2(x+3)^2
Answers: 1
Mathematics, 21.06.2019 22:00
Aprofessional hockey team has noticed that, over the past several seasons, as the number of wins increases, the total number of hot dogs sold at the concession stands increases. the hockey team concludes that winning makes people crave hot dogs. what is wrong with the hockey team's conclusion? a) it does not take into account the attendance during each season. b) it does not take into account the number of hamburgers sold during each season. c) it does not take into account the number of concession stands in the hockey arena. d) it does not take into account the number of seasons the hockey team has been in existence.
Answers: 1
Mathematics, 21.06.2019 22:30
3. a sum of $2700 is to be given in the form of 63 prizes. if the prize is of either $100 or $25, find the number of prizes of each type.
Answers: 1
You know the right answer?
It can be expensive to go to the movie theater. The scatter plot shown here gives the average cost i...
Questions

Mathematics, 26.09.2019 14:50

Arts, 26.09.2019 14:50

Biology, 26.09.2019 15:00


Physics, 26.09.2019 15:00

Business, 26.09.2019 15:00

Social Studies, 26.09.2019 15:00

Computers and Technology, 26.09.2019 15:00

Mathematics, 26.09.2019 15:00


