
Mathematics, 30.10.2021 14:00 BlehBlehBlehBleh
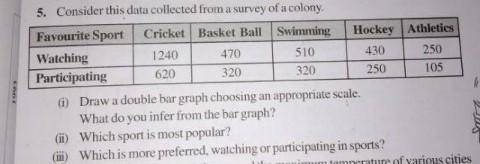
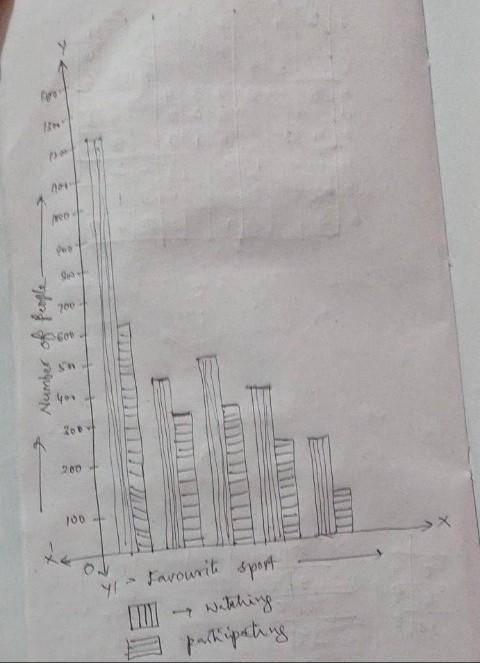
Consider this data collected from a survey of a colony Favourite Sport Cricket Basket Ball Swimming Hockey 430 Athletics 250 Watching Participating 1240 620 470 320 510 320 (i) Draw a double bar graph choosing an appropriate scale. 250 105 What do you infer from the bar graph? (ii) Which sport is most popular? (iii) Which is more preferred, watching or participating in sports?

Answers: 2
Another question on Mathematics
Mathematics, 21.06.2019 18:00
Pat listed all the numbers that have 15 as a multiple write the numbers in pats list
Answers: 3
Mathematics, 21.06.2019 21:30
Find the unit rate for: 75% high-fiber chimp food to 25% high -protein chimp food.
Answers: 2
Mathematics, 22.06.2019 01:00
Sioux co. replaced the roof on its existing building, therefore increasing the building's life by 10 years. the cost of the roof is considered a(n):
Answers: 3
Mathematics, 22.06.2019 02:00
1. the manager of collins import autos believes the number of cars sold in a day (q) depends on two factors: (1) the number of hours the dealership is open (h) and (2) the number of salespersons working that day (s). after collecting data for two months (53 days), the manager estimates the following log-linear model: q 4 equation 1 a. explain, how to transform the log-linear model into linear form that can be estimated using multiple regression analysis. the computer output for the multiple regression analysis is shown below: q4 table b. how do you interpret coefficients b and c? if the dealership increases the number of salespersons by 20%, what will be the percentage increase in daily sales? c. test the overall model for statistical significance at the 5% significance level. d. what percent of the total variation in daily auto sales is explained by this equation? what could you suggest to increase this percentage? e. test the intercept for statistical significance at the 5% level of significance. if h and s both equal 0, are sales expected to be 0? explain why or why not? f. test the estimated coefficient b for statistical significance. if the dealership decreases its hours of operation by 10%, what is the expected impact on daily sales?
Answers: 2
You know the right answer?
Consider this data collected from a survey of a colony Favourite Sport Cricket Basket Ball Swimming...
Questions
Mathematics, 11.11.2020 20:20

Mathematics, 11.11.2020 20:20

German, 11.11.2020 20:20


History, 11.11.2020 20:20

Geography, 11.11.2020 20:20

English, 11.11.2020 20:20
Mathematics, 11.11.2020 20:20
History, 11.11.2020 20:20

Chemistry, 11.11.2020 20:20
Mathematics, 11.11.2020 20:20


