
Mathematics, 20.10.2021 02:30 auriwhite05
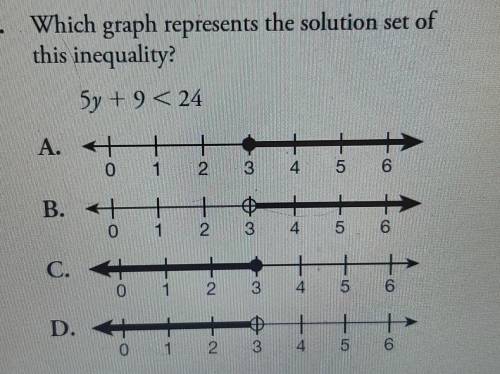
Which graph represents the solution set of this inequality? 5y + 9 < 24 A. H 1 0 2 3 4 5 6 B. 4 0 + 1 + 2 O♡ 3 4 5 6 C. 0 1 23 4 5 6 D. 0 1 2. 3 4 5 6

Answers: 2
Another question on Mathematics
Mathematics, 21.06.2019 16:50
1. the wheeling bridge in west virginia is about 307 meters long. if you walk with a stride of about meter, about how many steps would it take you to cross this suspension bridge?
Answers: 1
Mathematics, 21.06.2019 18:00
Which represents the solution set of the inequality 5x-9 < 21? a. x < 12/5 b. x > 12/5 c. x > 6 d. x < 6
Answers: 2
Mathematics, 21.06.2019 19:30
Asquare picture with sides of 32 inches is to be mounted on a square mat with sides of 52 inches. find the area of the mat that will remain uncovered by the picture.
Answers: 1
You know the right answer?
Which graph represents the solution set of this inequality? 5y + 9 < 24 A. H 1 0 2 3 4 5 6 B. 4 0...
Questions

English, 21.02.2022 02:50
Mathematics, 21.02.2022 02:50

English, 21.02.2022 03:00
Mathematics, 21.02.2022 03:00
Chemistry, 21.02.2022 03:00


Physics, 21.02.2022 03:00
History, 21.02.2022 03:00
Mathematics, 21.02.2022 03:00

Law, 21.02.2022 03:00

Mathematics, 21.02.2022 03:00


