
Mathematics, 20.09.2021 14:00 sjanem03
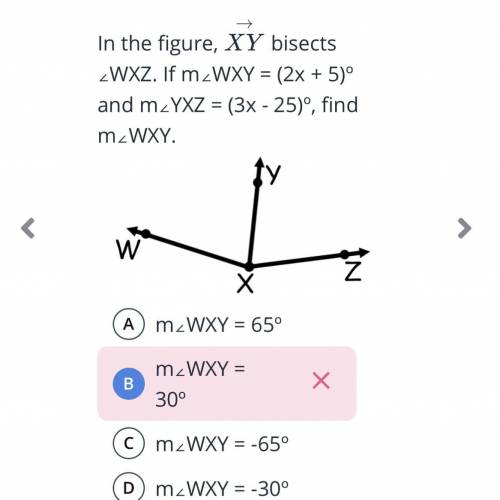
In the figure, XY bisects angle WXZ . If m angle WXY=(2x+5)^ and m angle YXZ=(3x-25)^ , find m angle WXY

Answers: 3
Another question on Mathematics
Mathematics, 21.06.2019 14:30
Part of the total score for each program is the sum of five program component scores. on the free program, the sum of these five program component scores is multiplied by a factor of 2.0. yuzuru hanyu, of japan, earned scores of 9.07, 8.96, 8.89, 9.21, and 9.36 for the program components portion of his free program. how many total points did he receive for this portion?
Answers: 1
Mathematics, 21.06.2019 15:10
The highest point on earth is the peak of mount everest if you climb to the top you would be approximately 29,035 feet above sea level at remembering that amount is 5280 feet percentage of the height of the mountain would you have to climb to reach a point 2 miles above sea level
Answers: 2
Mathematics, 21.06.2019 16:00
Part one: measurements 1. measure your own height and arm span (from finger-tip to finger-tip) in inches. you will likely need some from a parent, guardian, or sibling to get accurate measurements. record your measurements on the "data record" document. use the "data record" to you complete part two of this project. name relationship to student x height in inches y arm span in inches archie dad 72 72 ginelle mom 65 66 sarah sister 64 65 meleah sister 66 3/4 67 rachel sister 53 1/2 53 emily auntie 66 1/2 66 hannah myself 66 1/2 69 part two: representation of data with plots 1. using graphing software of your choice, create a scatter plot of your data. predict the line of best fit, and sketch it on your graph. part three: the line of best fit include your scatter plot and the answers to the following questions in your word processing document 1. 1. which variable did you plot on the x-axis, and which variable did you plot on the y-axis? explain why you assigned the variables in that way. 2. write the equation of the line of best fit using the slope-intercept formula $y = mx + b$. show all your work, including the points used to determine the slope and how the equation was determined. 3. what does the slope of the line represent within the context of your graph? what does the y-intercept represent? 5. use the line of best fit to you to describe the data correlation.
Answers: 2
Mathematics, 21.06.2019 17:00
The rectangle on the right is the image of the rectangle on the left. what transformation would result in this image? reflection rotation translation dilation
Answers: 2
You know the right answer?
In the figure, XY bisects angle WXZ . If m angle WXY=(2x+5)^ and m angle YXZ=(3x-25)^ , find m angle...
Questions
Mathematics, 10.03.2021 20:00


Chemistry, 10.03.2021 20:00
Mathematics, 10.03.2021 20:00
Chemistry, 10.03.2021 20:00
Mathematics, 10.03.2021 20:00


History, 10.03.2021 20:00

Mathematics, 10.03.2021 20:00
Mathematics, 10.03.2021 20:00

Computers and Technology, 10.03.2021 20:00


