
Mathematics, 15.09.2021 15:50 estefaniapenalo
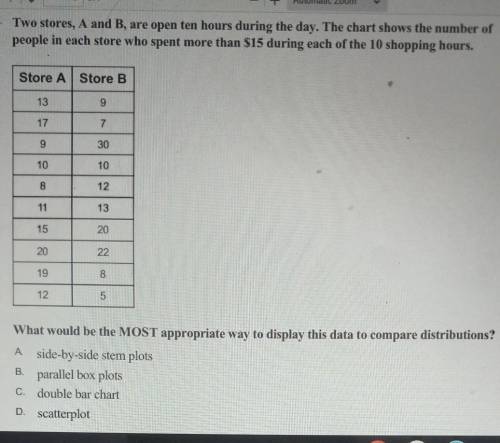
1. Two stores, A and B, are open ten hours during the day. The chart shows the number of people in each store who spent more than $15 during each of the 10 shopping hours. Store A Store B 13 9 17 7 9 30 10 10 8 12 11 13 15 20 20 22 19 8 12 5 A What would be the MOST appropriate way to display this data to compare distributions? side-by-side stem plots B. parallel box plots C. double bar chart D. scatterplot C

Answers: 3
Another question on Mathematics
Mathematics, 21.06.2019 14:30
Paint color preference children adults total 0.6 0.77 liked new paint color disliked new paint color 0.4 0.15 0.23 total 1.0 1.0 1.0 which value for x completes the conditional relative frequency table by column?
Answers: 2
Mathematics, 21.06.2019 16:30
Kelly is a salesperson at a shoe store, where she must sell a pre-set number of pairs of shoes each month. at the end of each work day the number of pairs of shoes that she has left to sell that month is given by the equation s=300-15x , where s is the number of pair of shoes kelly still needs to sell and x is the number of days she has worked that month. what is the meaning of the number 300 in this equation
Answers: 3
Mathematics, 21.06.2019 18:30
Aswimming pool had 2.5 million liters of water in it. some water evaporated, and then the pool only had 22 million liters of water in it. what percent of the water evaporated?
Answers: 1
Mathematics, 21.06.2019 19:00
How much orange juice do you need to make 2 servings of lemony orange slush?
Answers: 1
You know the right answer?
1. Two stores, A and B, are open ten hours during the day. The chart shows the number of people in e...
Questions

History, 07.10.2019 01:00


Mathematics, 07.10.2019 01:00

Social Studies, 07.10.2019 01:00

English, 07.10.2019 01:00


Business, 07.10.2019 01:00
History, 07.10.2019 01:00

English, 07.10.2019 01:00

Chemistry, 07.10.2019 01:00
English, 07.10.2019 01:00


